|
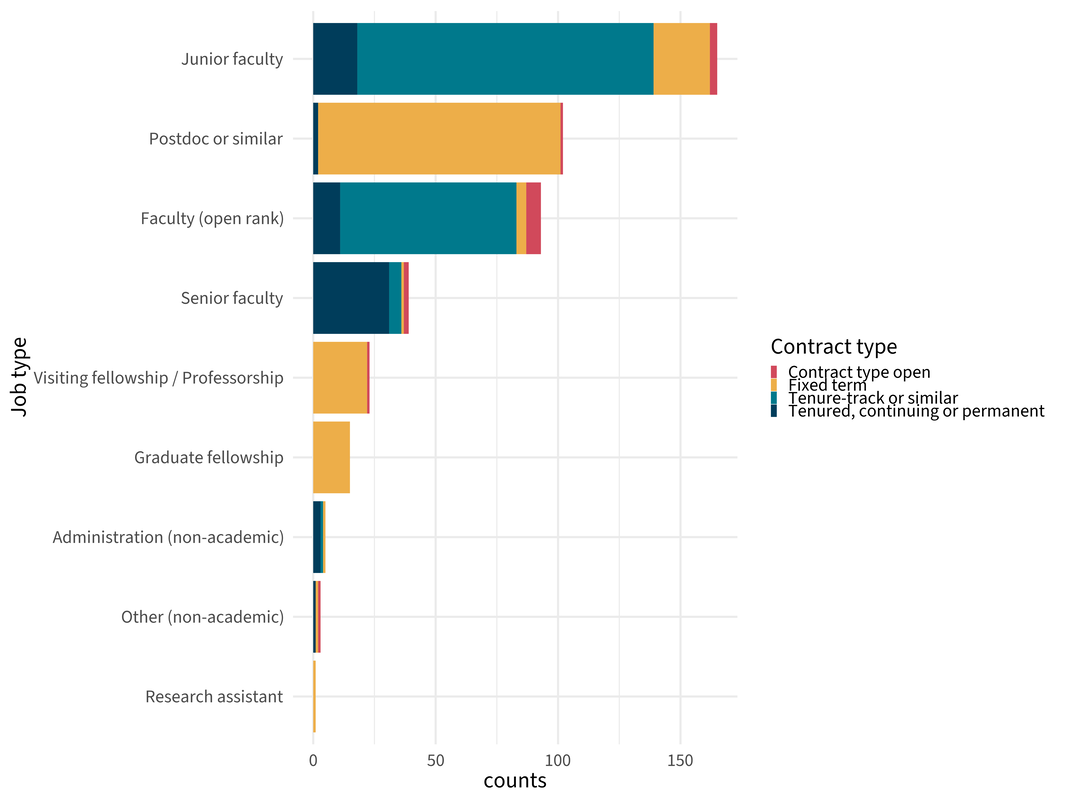
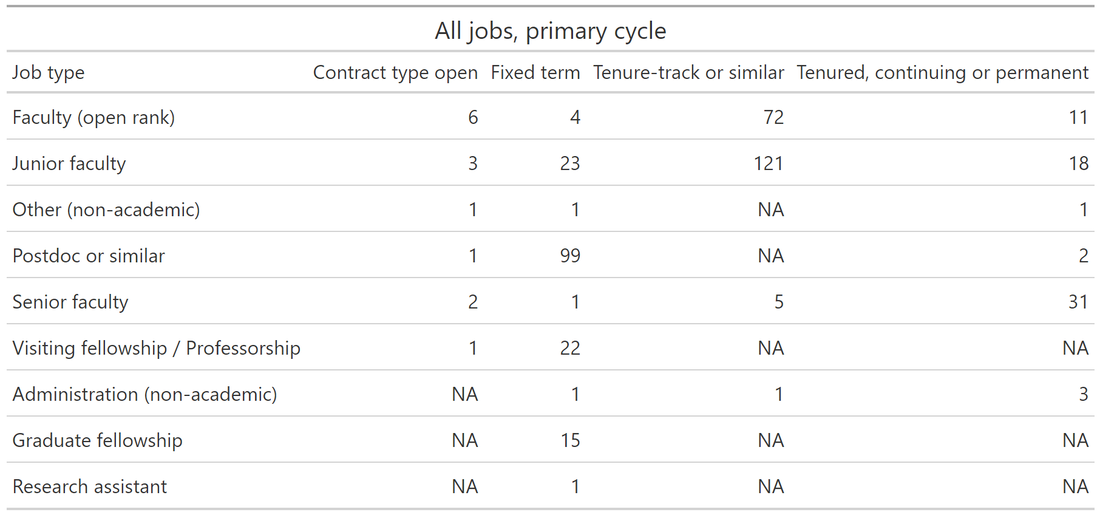
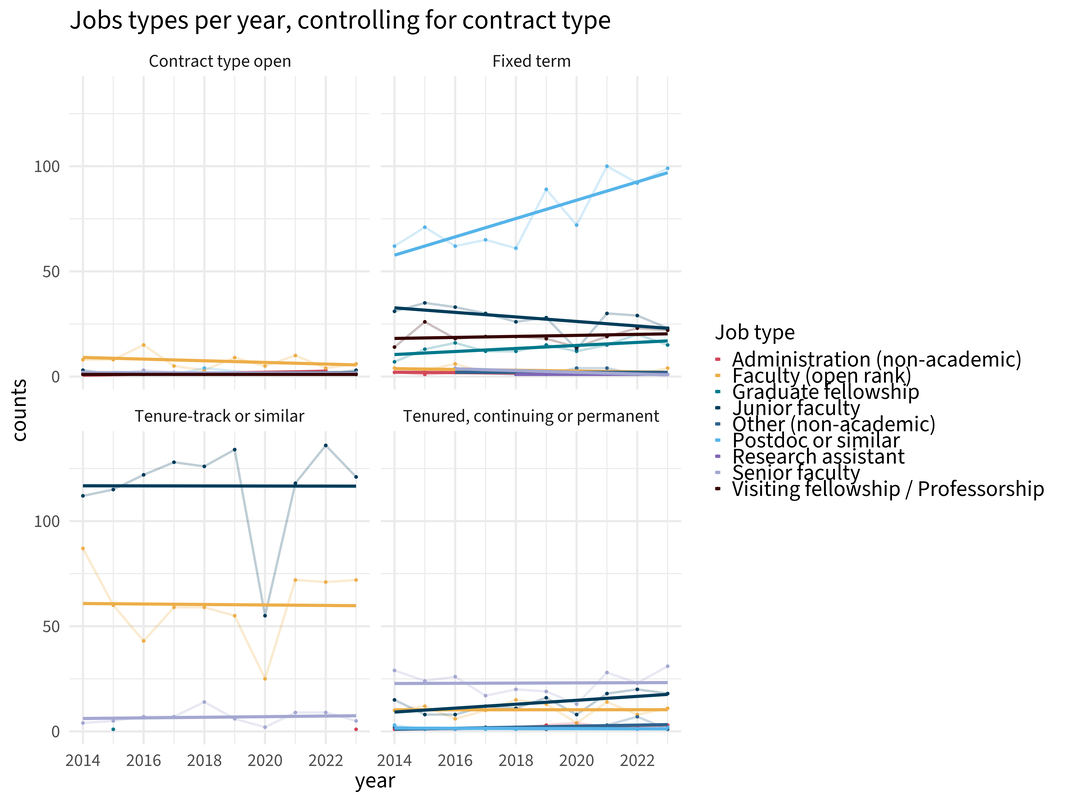
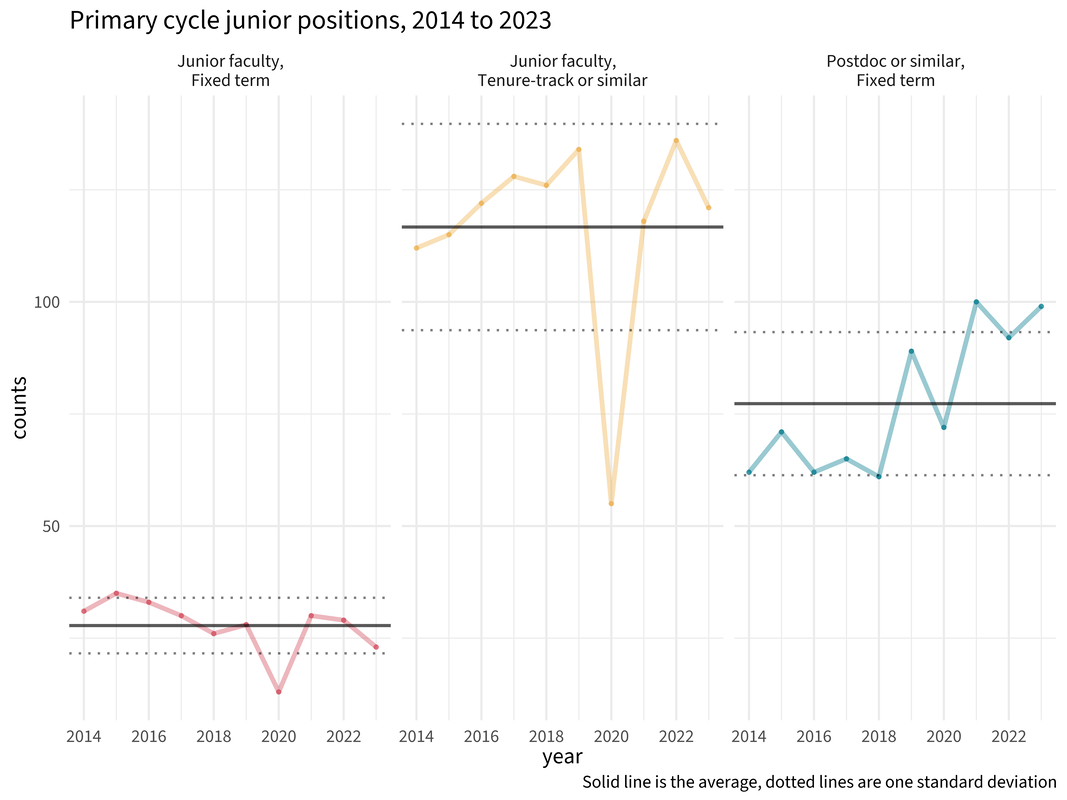
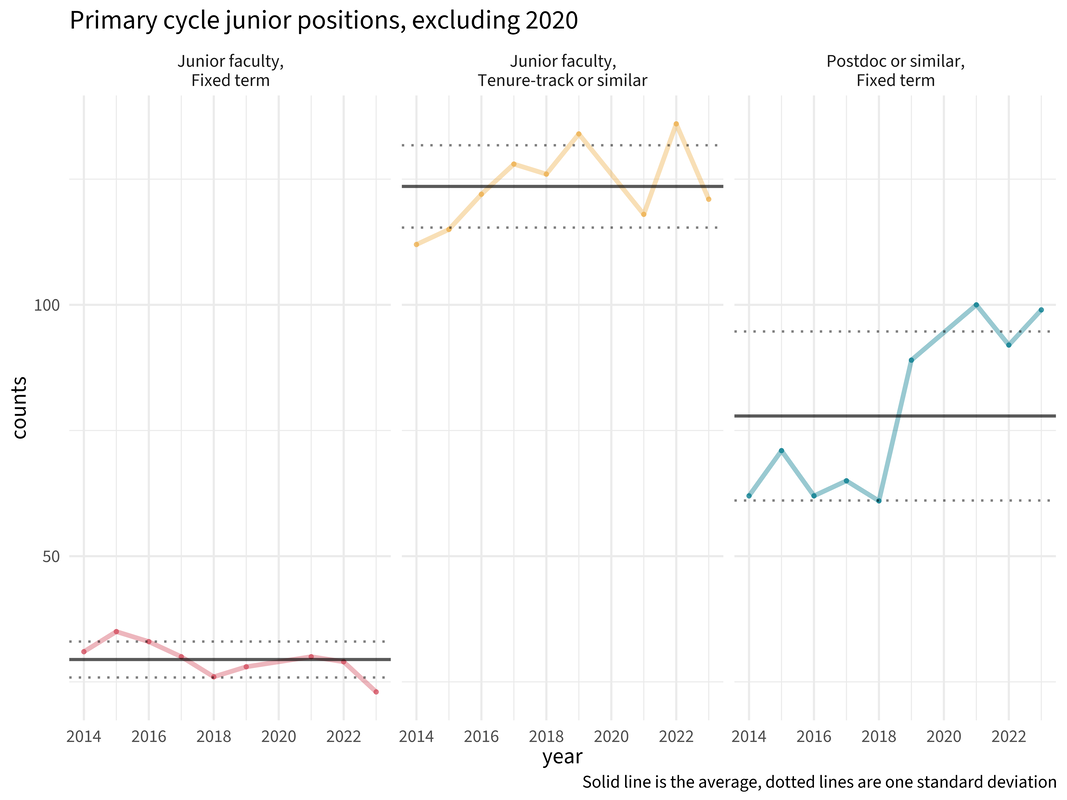
Hello again, friends! The numbers are in, and let's take a gander at the job market this past cycle. As a reminder, I define "primary cycle" as running from July to December. Let's start with the overall picture. The biggest groups were tenure-track and postdoc, followed by open rank hires. Here are the numbers for each. Now for the historical perspective. The solid lines are the regression. Some depressing info here. For the primary job cycle, tenure-track jobs for junior faculty have shown no growth since 2014. But things look different if we leave out 2020. (More on that below.) Excluding that awful awful year, tenure-track jobs trend upwards. Huzzah! Fixed-term junior jobs are trending slightly downwards. But given what the data suggest about more fixed-term jobs being advertised in the secondary cycle, this isn't too surprising. What jobs are rising most quickly? Postdocs. That's good news for freshly-minted PhDs as far as paying next month's rent, but those jobs are for a limited time only. Additionally, it's no secret that postdoc gigs tend to be relatively low-pay for high-labor. Some postdocs are pushing back. (That article looks at science postdocs and not philosophy ones. If readers want to chime in with their experiences, please do.) One explanation is that more stable and high-paying jobs are being replaced by postdocs, which saves universities a lot of scratch--the research version of relying on adjuncts to meet demand. Finally, let's take a look at junior positions over time. Fixed term and tenure-track junior positions are below and above average (respectively) but still within one standard deviation. But what if we exclude 2020 as an outlier? Here's what we see: Tenure-track jobs did unusually well in 2019 and 2022 primary cycles, and 2023 is below average but not terribly so. Fixed term is lower than one SD and postdocs are higher than one SD--both of which, I think, are concerning trends even with this more optimistic view of the market.
So what to conclude? I think the big question is, should 2020 be excluded from the data as an outlier? Doing so gives a rosier view of the market. However my own hunch is to say "no," and not just because I haven't had my afternoon coffee. An oft-shared joke on social media is that we're experiencing once-in-a-lifetime events more frequently. The recession of 2007-2009 hit the market hard. Just over a decade later, COVID hit the market hard again. It is, of course, a challenge to predict global catastrophes, but there will surely be more as the effects of climate change are felt more acutely. As a matter of personal preference, given the choice of being optimistic or guarded about the future of the philosophy job market, I play it conservative. Still, I'm open to arguments that 2020 really is an outlier and can be (relatively) safely excluded. That's all. Thanks, as always, for reading. If there are other analyses you'd like to see, please let me know! To my fellow R users: If you want to start playing with new color palettes, try out coolors.co. It has some great tools, and it's how I got the colors for these plots. And if you want to try out new fonts (these plots use Source Sans 3 from Google), this is a great guide.
0 Comments
|
About me
I do mind and epistemology and have an irrational interest in data analysis and agent-based modeling. Old
|

 RSS Feed
