Soaked Feet,
Bone-dry cuffs

|
Greetings from the Pacific APA! There are lots of great papers and folks--it's just day 2 and the sessions on Phil of Psychiatry, the History of Analytic Phil, and Care/Forgiveness/Trust have been just phenomenal. To the task at hand: Over the course of last semester, I sent out requests to heads of search committees to fill out a brief survey to figure out how many people were on the job market this past cycle.  First, a HUGE thanks to Gonzaga undergrad Kate Ferrell and Gonzaga philosophy grad student Tobias Propst for collecting the names and email addresses. Without them, this would have taken a lot longer. I sent out 239 emails and gathered 79 completed responses. Thank you to everyone who filled it out!Here's the breakdown of responses by Carnegie classification: Certificate: 1 Bachelors: 25 Masters : 6 Doctorate : 43 I didn't collect identifying information about the institutions or programs. I asked for number of applicants, AOS, Carnegie classification (R1, R2, MA, BA, certificate), teaching requirements, and some subjective impressions about volume of applications proportion of teaching and research. (Quick note about terminology: from here on, I use "status" as shorthand for the category of highest degree awarded. It seems like a neutral-ish and short term for the category.) Ok, so let's get to it. The big picture: the average for numbers of applicants across all responses is 136. Given the responses and the number of invitations sent out, the margin of error is +/- 9% (with 95% confidence level). So the average for number of people on the market is probably somewhere between 125 and 147. That being said, there is a lot of variation. 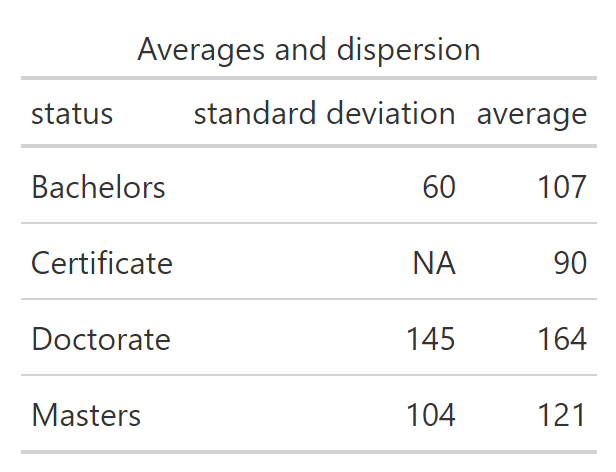 The number of applicants to jobs at doctoral institutions was higher on average than any other, but there was a lot more spread around that average. This is clear from the table, but also look at the following plots. Differences among numbers of applicants to BA-granting institutions are roughly linear. But for PhD-granting institutions, it's closer to exponential. (There were relatively few MA-granting institution responses, so I'm hesitant to draw conclusions.) 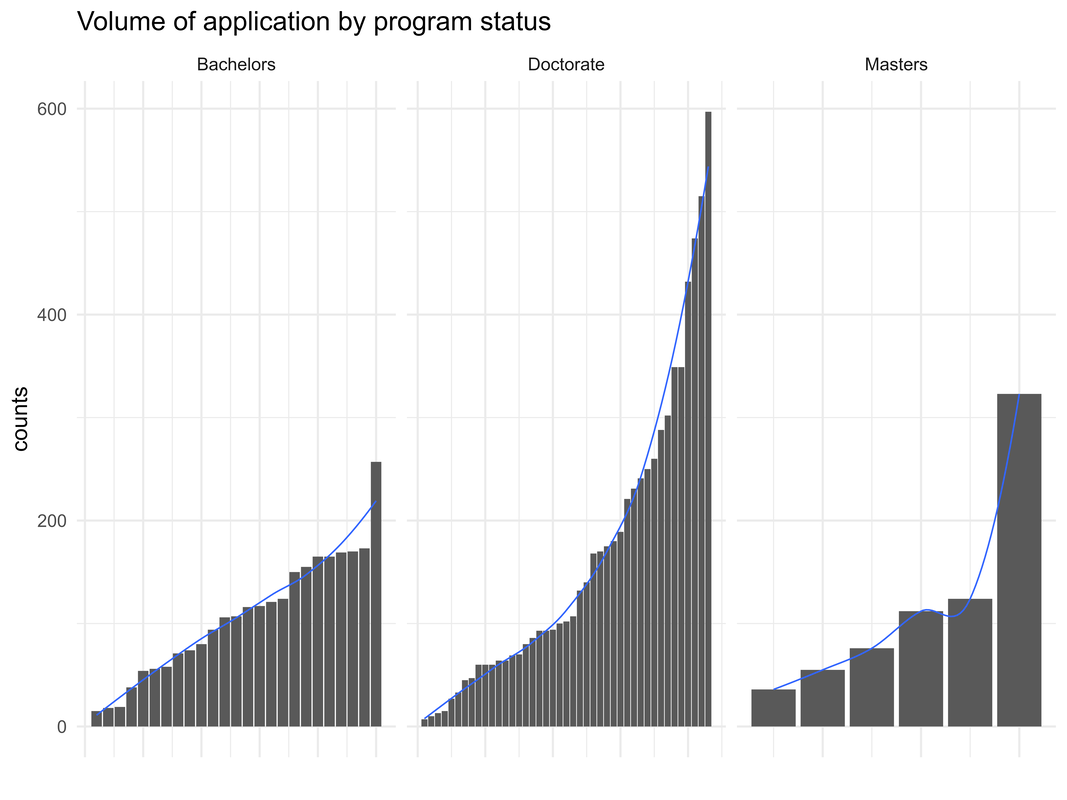 Now let's pull together a bunch of info about applications to various programs: the fewest, average, median, and greatest number of applicants by program status. 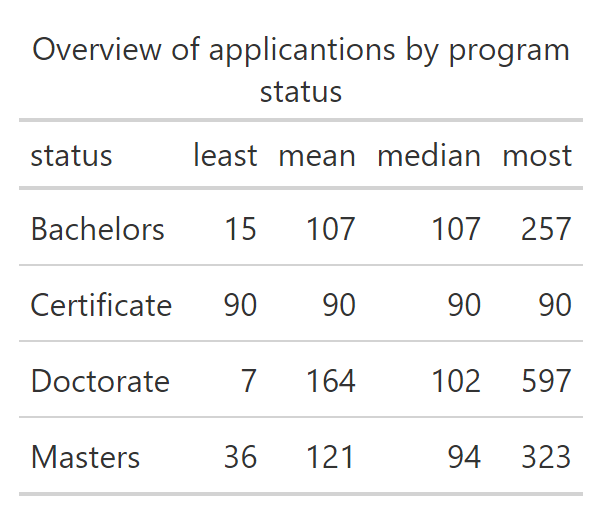 It looks like jobs with PhD programs are getting a lot more applications than any other. In fact, the values for max and average applications decreases as the status of the program goes from PhD to MA to BA. (It's hard to draw conclusions about jobs at certificate-granting institutions since there was only one response.) A first hypothesis: Applicants preferentially apply for jobs at PhD-granting institutions. Two things to check: (i) whether the trend holds for R1 and R2 and (ii) if the values are a result of open-rank hires. For (i), the trend doesn't hold for differences between R1 and R2 jobs among respondents, but it's worth noting that there were relatively few R2 respondents. 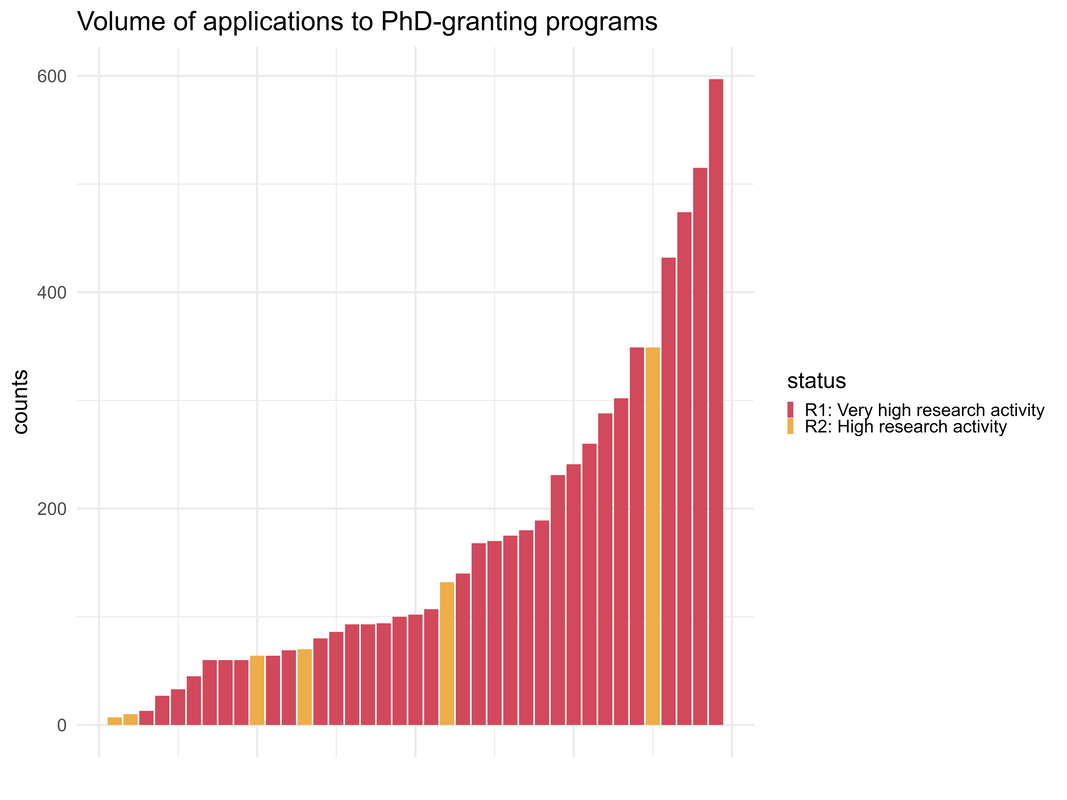 For (ii), let's restrict the data to TT jobs only. That way, our numbers aren't inflated by open-rank hires. 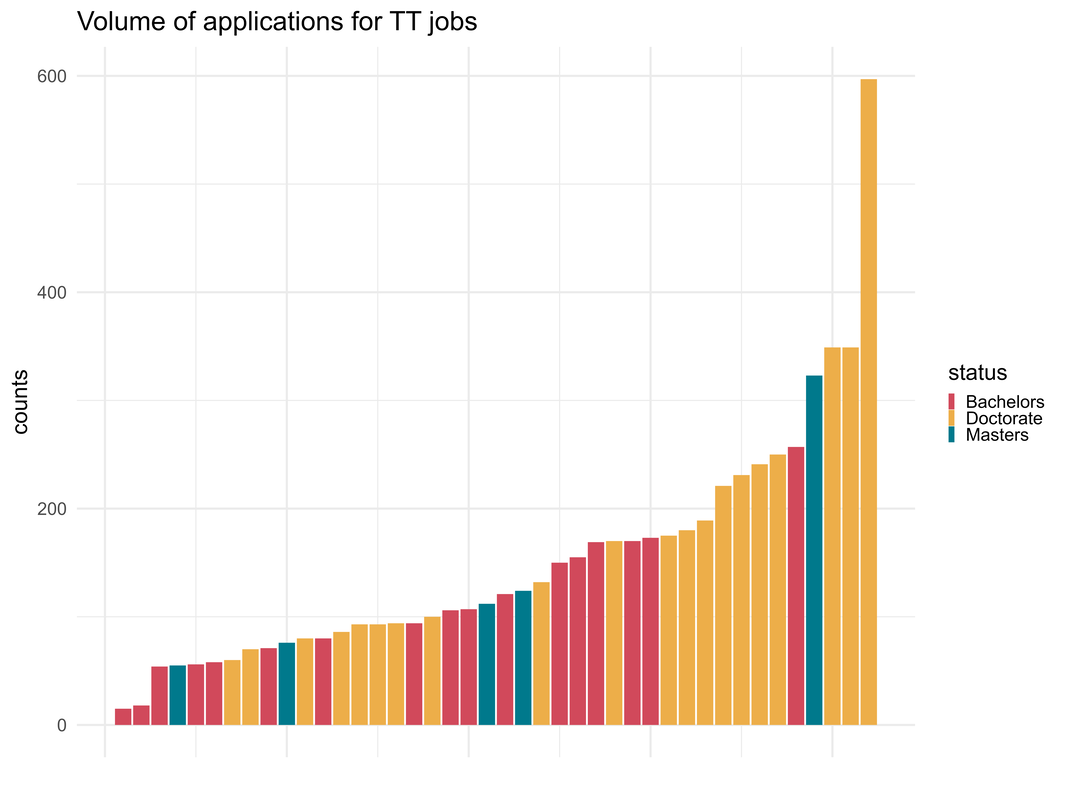 I think our initial hypothesis is right: applicants are biased towards applying for jobs at PhD-granting programs but the data don't suggest that this bias holds for R1 vs R2 programs. Let's look at the numbers breaking out by AOS and program status. An important caveat: our 9% margin of error was for all responses to all surveys sent out. Once we begin dividing up the pool of responses, the margin of error increases and sometimes substantially. Suppose that the split between jobs advertised for BA- and PhD-granting institutions was 50/50. The MoE for the BA-granting average jumps to 17% and for the PhD-granting average to 12%. So once we begin parsing into subgroups, I'm saying less about all jobs for this year and more about the responses. I'll try to be explicit about that where appropriate. 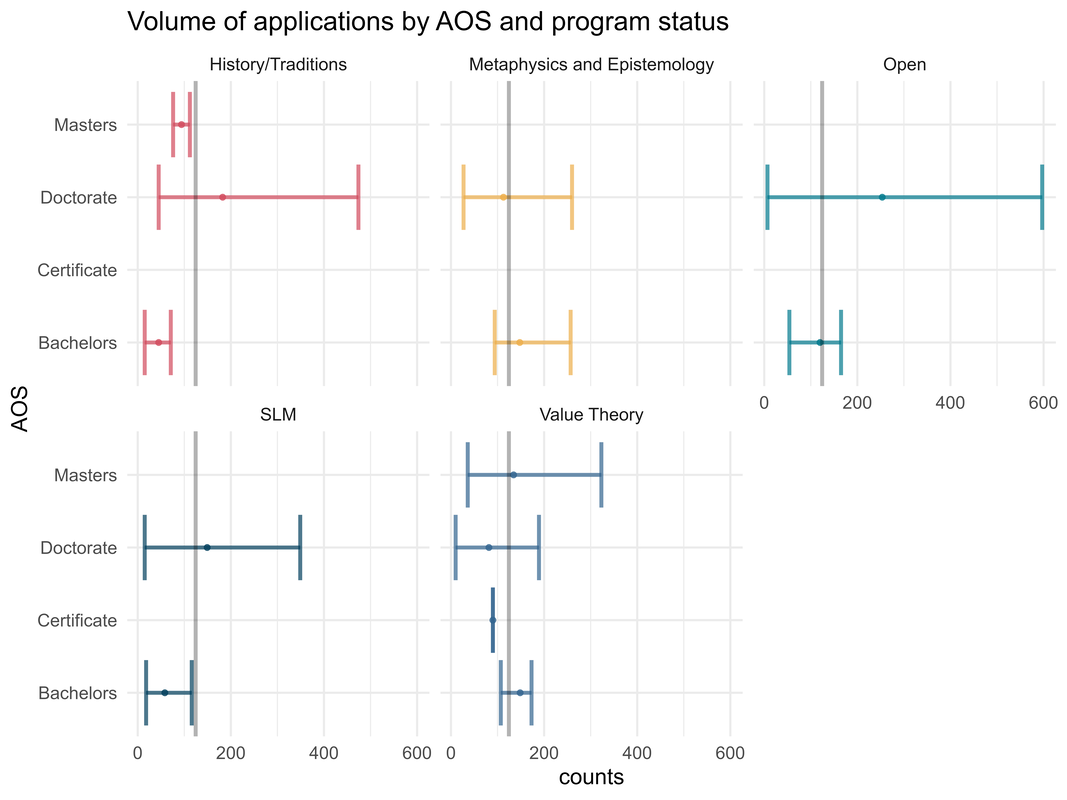 Here's how to interpret the plot. The vertical grey line is the average for each AOS. The error bars give the minimum and maximum values for each status and AOS. The point in the error bar is the average for AOS and status. The tables for these values are here. This plot pulls together a lot of what we've previously mentioned. Jobs at PhD-granting institutions tend to get more applications than elsewhere, particularly for open and history/tradition AOS. The jobs that on average had the fewest applications among respondents were history/tradition jobs at BA-granting institutions. In fact, in 2 out of 5 cases, the max number of applications for BA programs is less than the average for that AOS. My interpretation of PhD-programs having more applicants is a manifestation of two sides of prestige bias. On one side, it's plausible that many candidates want to apply almost exclusively to prestigious jobs, where being a PhD-granting program tracks prestige. The other side of the coin is that candidates sell themselves short, thinking that there's no way they could make it past the first round at an R1 or R2. That being said, if there are other plausible interpretations, please feel free to share! One of the takeaways restricted to the respondents (but is perhaps indicative of the wider field of applicants and openings) is that if you're applying to R1's, you'll likely find yourself with a lot more competition relative to MA- and BA-granting programs, particularly for open, science/language/math, and history/tradition AOS's. Two more tables before calling it a day: one about impressions of applicant volume and another about time allotment for the job. 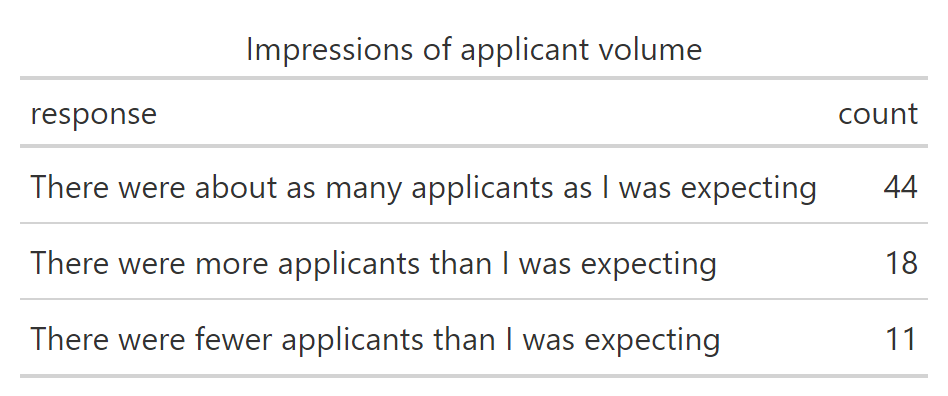 So that's good to know: typically, committee chairs have decent expectations for the numbers of applicants. How does this compare to the numbers of applications received? 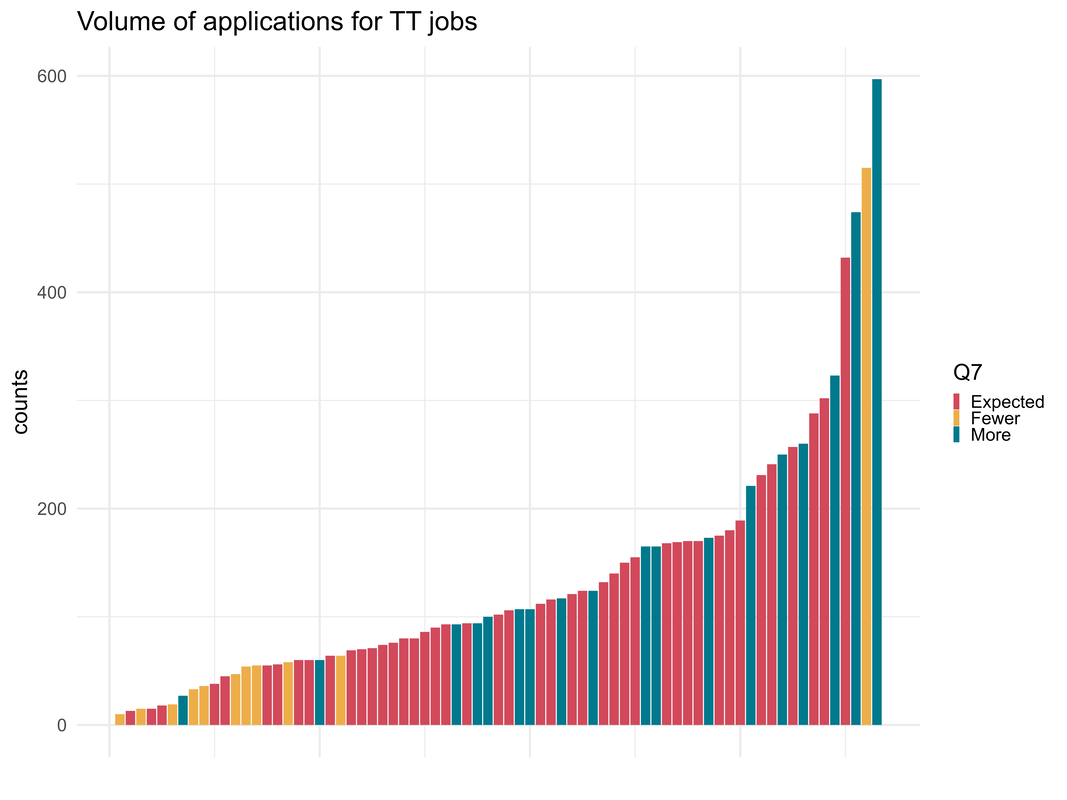 The "fewer" bar all the way to the right? That's 515 applications for an open AOS, open rank position at an R1. With those parameters, I'd have guessed there would be more too. 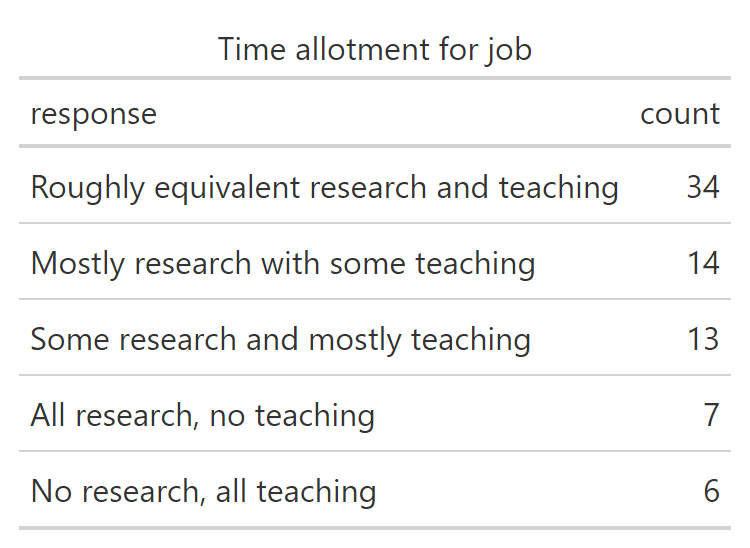 That's useful to know: the typical response is that time spent teaching and researching is roughly equivalent. The breakdown for that number is:
BA-granting institutions: 8 MA-granting institutions: 4 PhD-granting institutions: 22 ...which I found pretty darned interesting. As you might imagine, "mostly research with some teaching," was largely PhD-granting institutions (12) and "some research and mostly teaching" was largely BA-granting institutions (10). The lesson, I think, is that job applicants can't afford to neglect teaching or research in their applications but have to discern which to amplify for the job applied to. I think that's common sense, but it's nice to have some info to support it. If you'd like the raw data and script, you can find them under the "blog data" tab. Well, that's all. If there are any other analyses you'd like to see, please let me know!
0 Comments
Hello again, friends! The numbers are in, and let's take a gander at the job market this past cycle. As a reminder, I define "primary cycle" as running from July to December. Let's start with the overall picture. 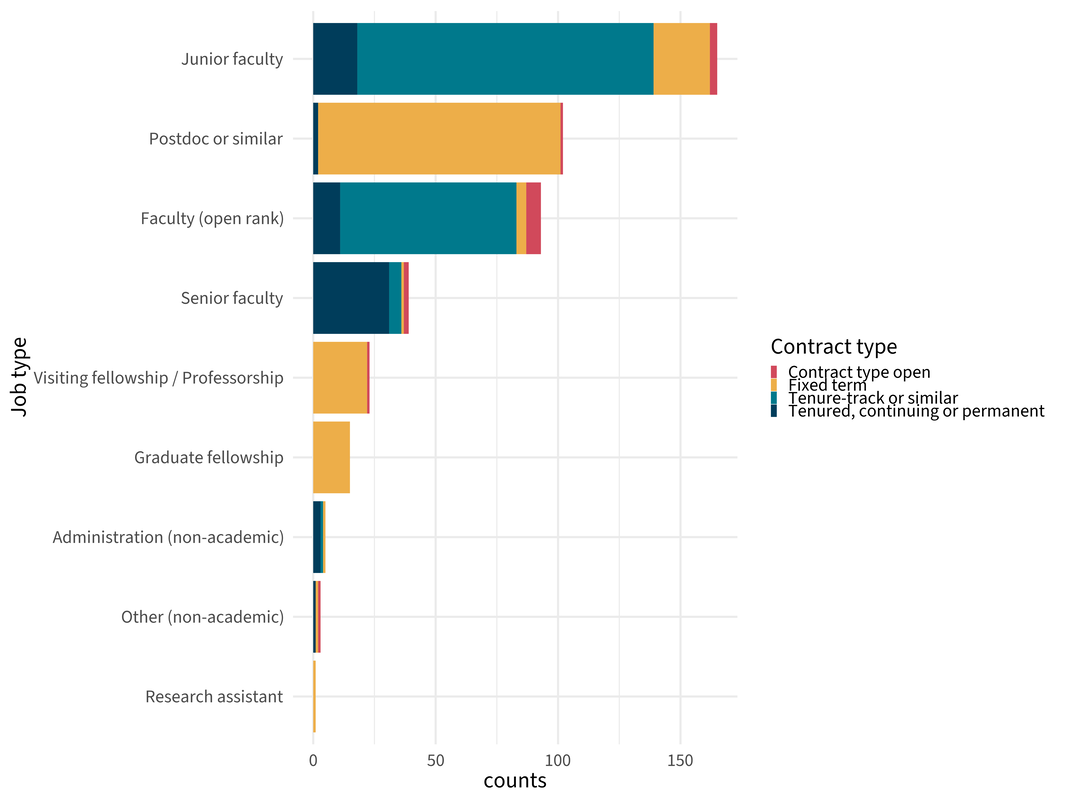 The biggest groups were tenure-track and postdoc, followed by open rank hires. Here are the numbers for each. 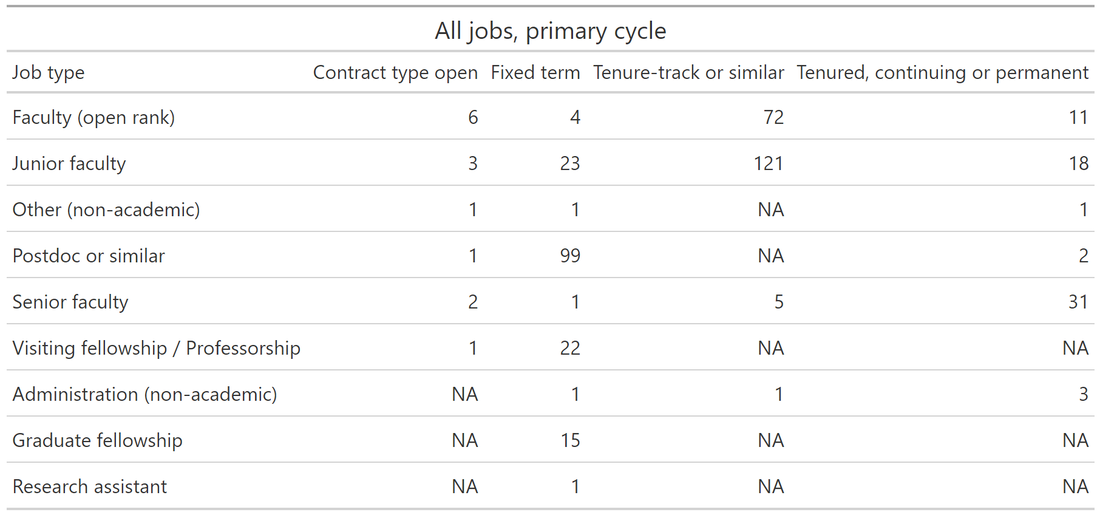 Now for the historical perspective. The solid lines are the regression. 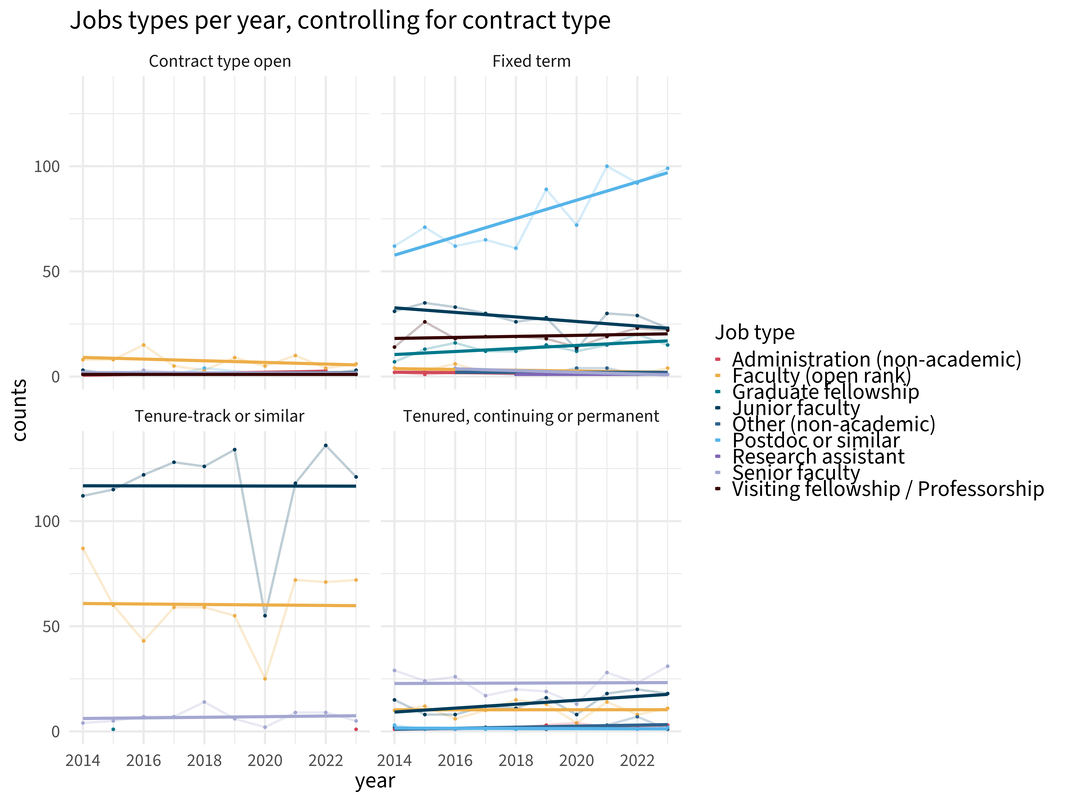 Some depressing info here. For the primary job cycle, tenure-track jobs for junior faculty have shown no growth since 2014. But things look different if we leave out 2020. (More on that below.) Excluding that awful awful year, tenure-track jobs trend upwards. Huzzah! Fixed-term junior jobs are trending slightly downwards. But given what the data suggest about more fixed-term jobs being advertised in the secondary cycle, this isn't too surprising. What jobs are rising most quickly? Postdocs. That's good news for freshly-minted PhDs as far as paying next month's rent, but those jobs are for a limited time only. Additionally, it's no secret that postdoc gigs tend to be relatively low-pay for high-labor. Some postdocs are pushing back. (That article looks at science postdocs and not philosophy ones. If readers want to chime in with their experiences, please do.) One explanation is that more stable and high-paying jobs are being replaced by postdocs, which saves universities a lot of scratch--the research version of relying on adjuncts to meet demand. Finally, let's take a look at junior positions over time. 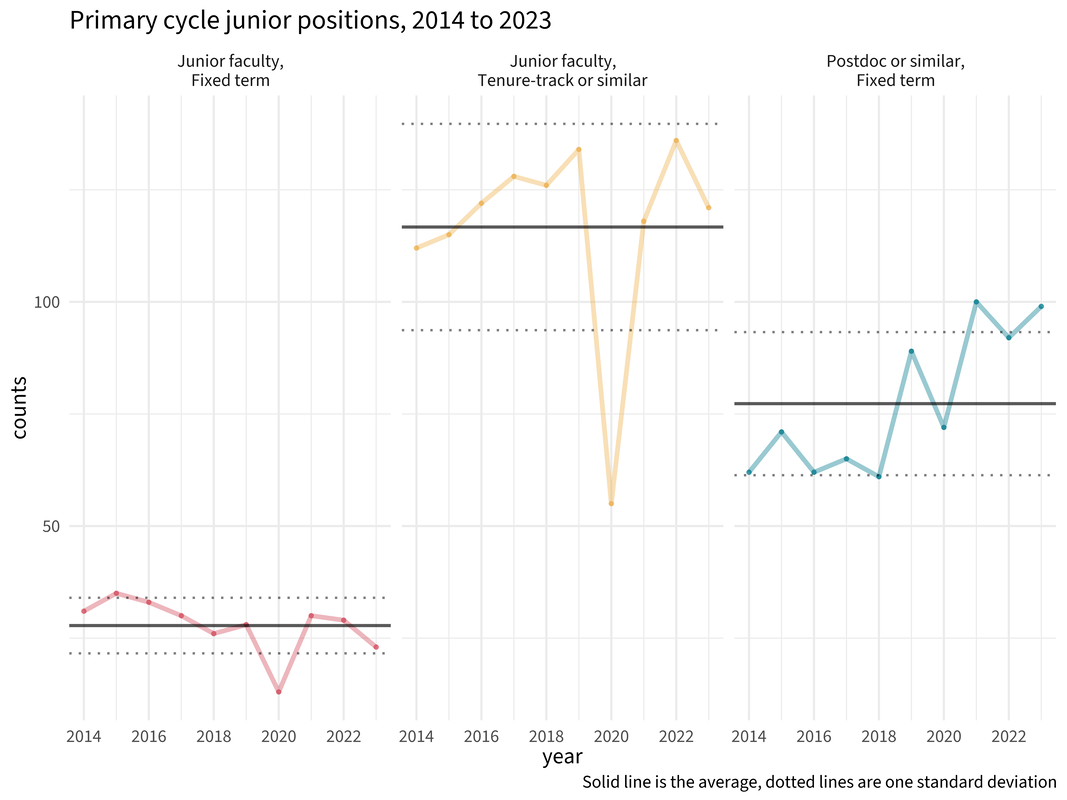 Fixed term and tenure-track junior positions are below and above average (respectively) but still within one standard deviation. But what if we exclude 2020 as an outlier? Here's what we see: 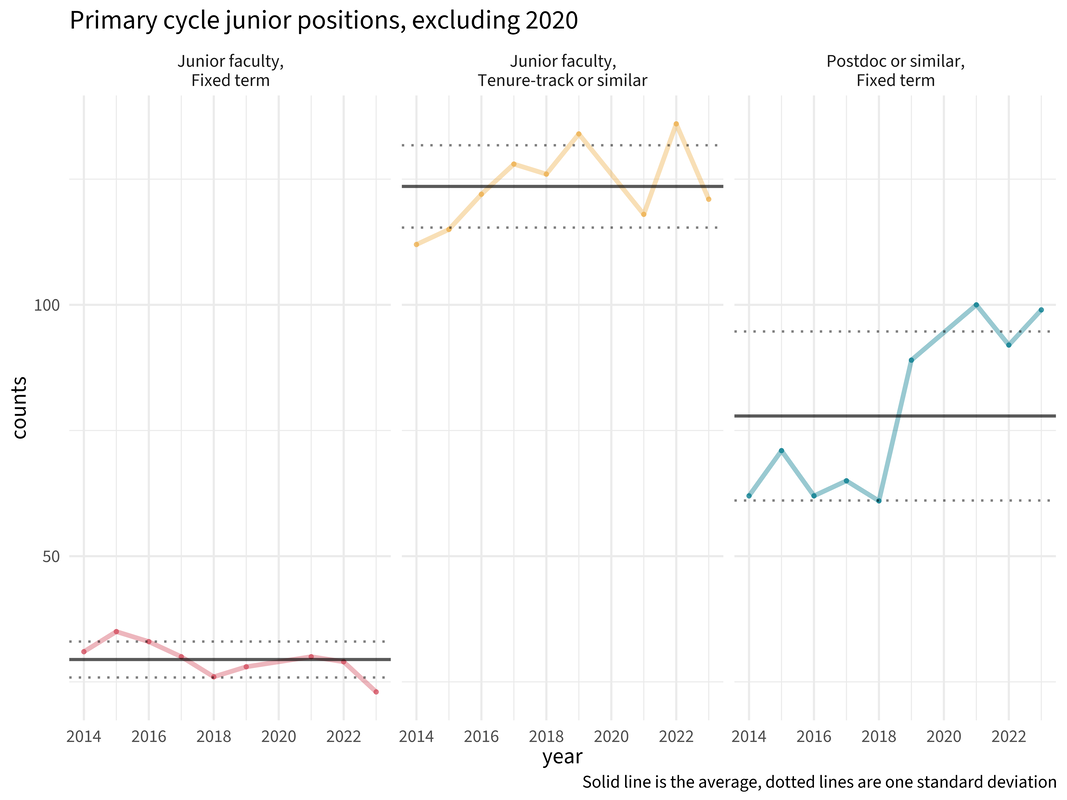 Tenure-track jobs did unusually well in 2019 and 2022 primary cycles, and 2023 is below average but not terribly so. Fixed term is lower than one SD and postdocs are higher than one SD--both of which, I think, are concerning trends even with this more optimistic view of the market.
So what to conclude? I think the big question is, should 2020 be excluded from the data as an outlier? Doing so gives a rosier view of the market. However my own hunch is to say "no," and not just because I haven't had my afternoon coffee. An oft-shared joke on social media is that we're experiencing once-in-a-lifetime events more frequently. The recession of 2007-2009 hit the market hard. Just over a decade later, COVID hit the market hard again. It is, of course, a challenge to predict global catastrophes, but there will surely be more as the effects of climate change are felt more acutely. As a matter of personal preference, given the choice of being optimistic or guarded about the future of the philosophy job market, I play it conservative. Still, I'm open to arguments that 2020 really is an outlier and can be (relatively) safely excluded. That's all. Thanks, as always, for reading. If there are other analyses you'd like to see, please let me know! To my fellow R users: If you want to start playing with new color palettes, try out coolors.co. It has some great tools, and it's how I got the colors for these plots. And if you want to try out new fonts (these plots use Source Sans 3 from Google), this is a great guide. Hello! This post is going to be a long one. So get some coffee or tea or beer and let's get to it. First some preliminaries. Counting AOS's is hard. Here's how I'm doing it. There are ads that had one AOS: history/traditions, open, etc. But there are others that are disjunctions: history/traditions or metaphysics/epistemology. Since we're looking at major trends, I counted each member of the disjunction separately. So if the AOS was metaphysics/epistemology or value theory, then the total count for metaphysics/epistemology goes up by one and same for value theory. Breaking up and counting disjunctions in this way tells us more about disclipinary trends than either (i) dropping one-off disjunctions or (ii) keeping disjunctions as their own categories. If you're interested in more fine-grained analyses, go ahead and check out the data set. It's available in the "blog data" section of the website. Second, there are some AOS that don't fit neatly into any of the categories on PhilJobs, like philosophy of technology. I did my best in each case to figure out what the job was looking for and then apply the relevant tags. Readers are welcome to follow up with the data under the "Blog Data" tab. Third, the numbers in each plot are not a count of jobs. If an ad has A or B or C as main AOS's, each AOS counts in the tally towards the number of A's, B's, and C's in the data. And if we're treating the numbers as counts for jobs, then that one job gets counted three times. So use the values as comparisons within a plot, not across plots. Finally, AOS's here are divided into two kinds. There are main AOS's. Those are: (1) open, (2) value theory, (3) metaphysics/epistemology, (4) history/traditions, and (5) science/logic/mathematics. Under each of these (except "open"), there are other, more detailed AOS's, like ethics, aesthetics, and philosophy of religion under value theory. "Main AOS" will be used to pick out one of the five top-level categories. "Detail AOS" will be used to pick out second-level categories. One of the themes I'll come back to throughout this post is looking at detailed AOS's alone versus with other AOS's. It seems this can provide some insight into the structure of the discipline. First, a working hypothesis: Ads featuring multiple main AOS's would be more likely to hire someone who ticks as many boxes as possible, all other things being equal. Why? Suppose an ad asks for specialization A or B. If you have two candidates who are equal in all other respects except one specializes in A while the other specializes in A and B, the latter candidate is more desirable than the former. If that's right, then the presence of multiple AOS's in an ad is a proxy for the desirability of candidates with fingers in several AOS pies and the popularity of crossing intradisciplinary boundaries. Ok, let's do it. First the big picture: 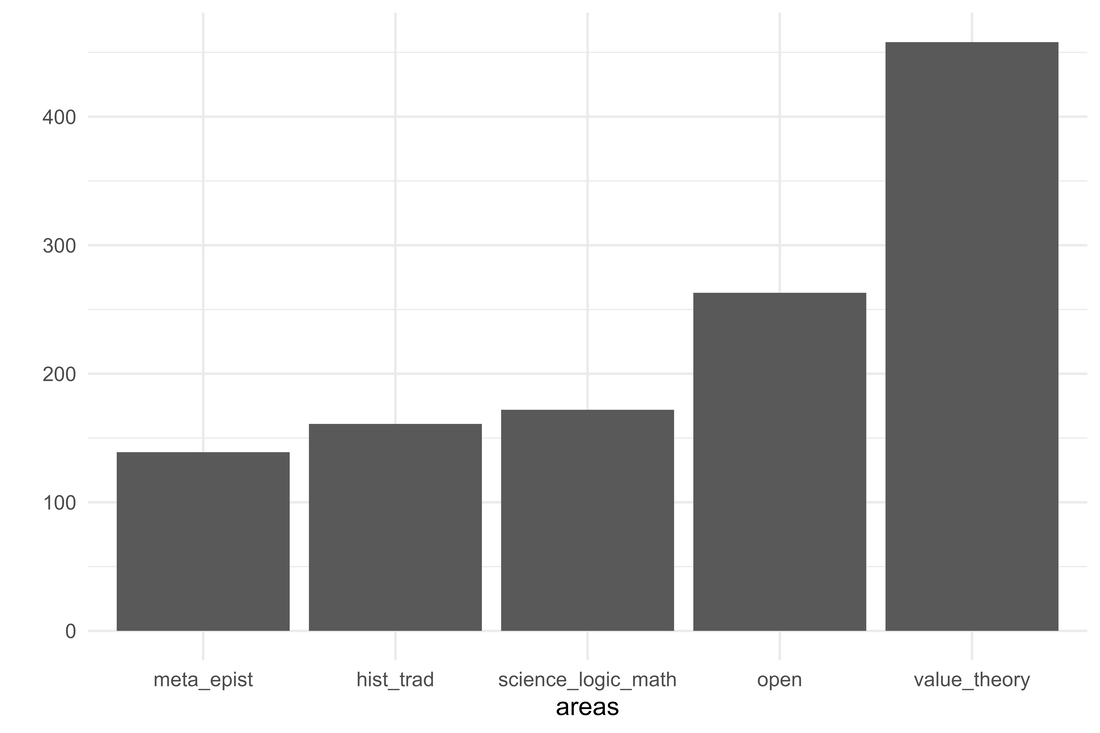 Value theory shows up most often in AOS, which (to be honest) is surprising. I would have guessed "open" but here we are. The reason is that value theory showed up in a lot of disjunctions: value theory or metaphysics/epistemology; value theory or history/traditions, etc--that is, lots of jobs were for value theory alongside some other area. Now, if we don't break up the disjunctions (against what I said above), "open" has the greatest number of ads. So the story here is that value theory had a very good year, showing up a lot both as a solo AOS and alongside other AOS's. Metaphysics/epistemology, science/logic/math and history/traditions are roughly on par with one another. Personally, I find metaphysics/epistemology bringing up the rear to be kind of surprising. When I was in grad school (*cue sounds of a rocking chair*), LEMMings were all the rage. Maybe not so much anymore. Ok, now let's zoom in on each of these Value TheoryHere are the more detailed areas for ads in value theory. 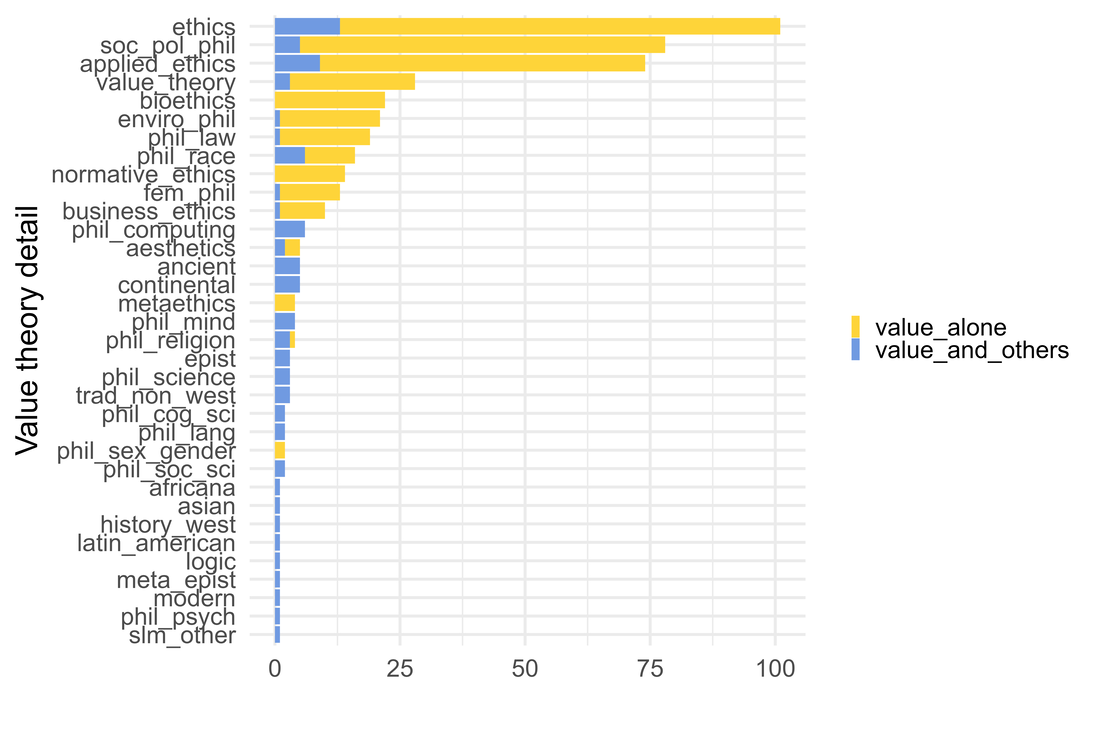 Fairly self-explanatory, but a few things of note. First, for the top 11 detailed AOS (ethics through business ethics), the overwhelming majority of ads feature value theory alone as the main AOS. Second, there's nonetheless a long tail on the data, so value theory shows up with a lot of other AOS's. The dominance of ethics and social-political philosophy isn't too surprising. These are mainstays of gen ed requirements. You'll notice some that seem strange on a list of value theory: philosophy of computing, epistemology, and philosophy of mind (among others). Let's parse out the data to see differences in ads that are value theory alone and value theory with other AOS's. First we look at value theory all by its lonesome: 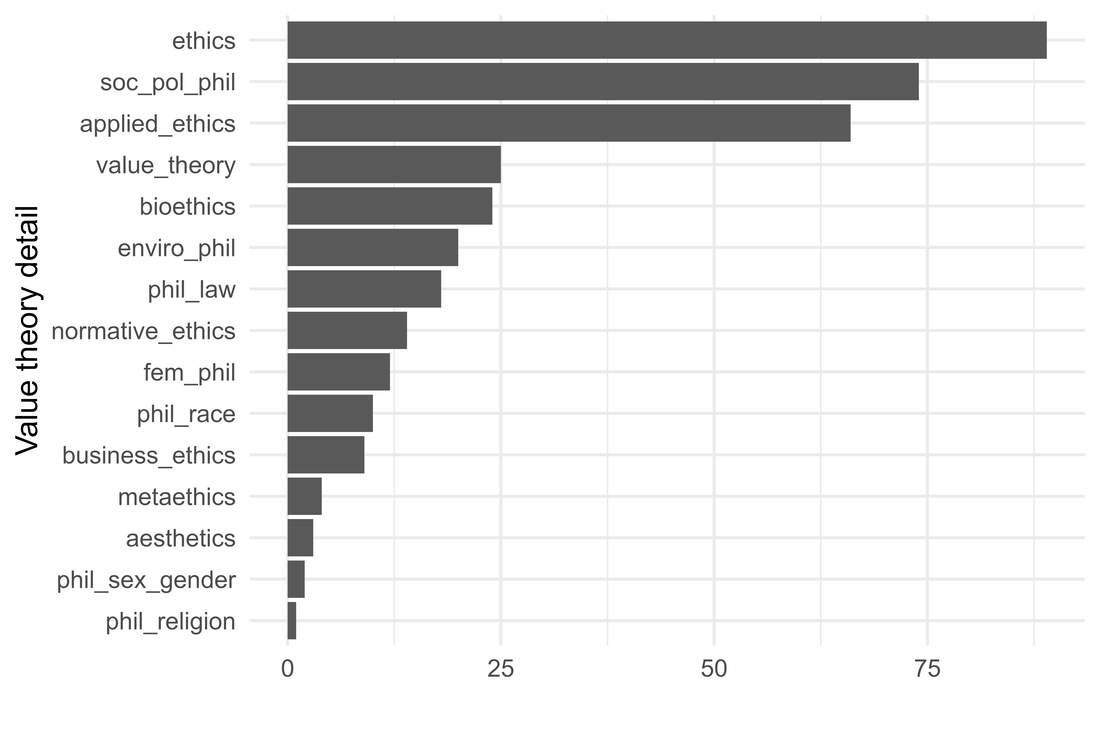 The structure of the data (more or less) reflects the big picture above: ethics, soc-pol, and applied ethics taking the lead with other value theory categories trailing behind. 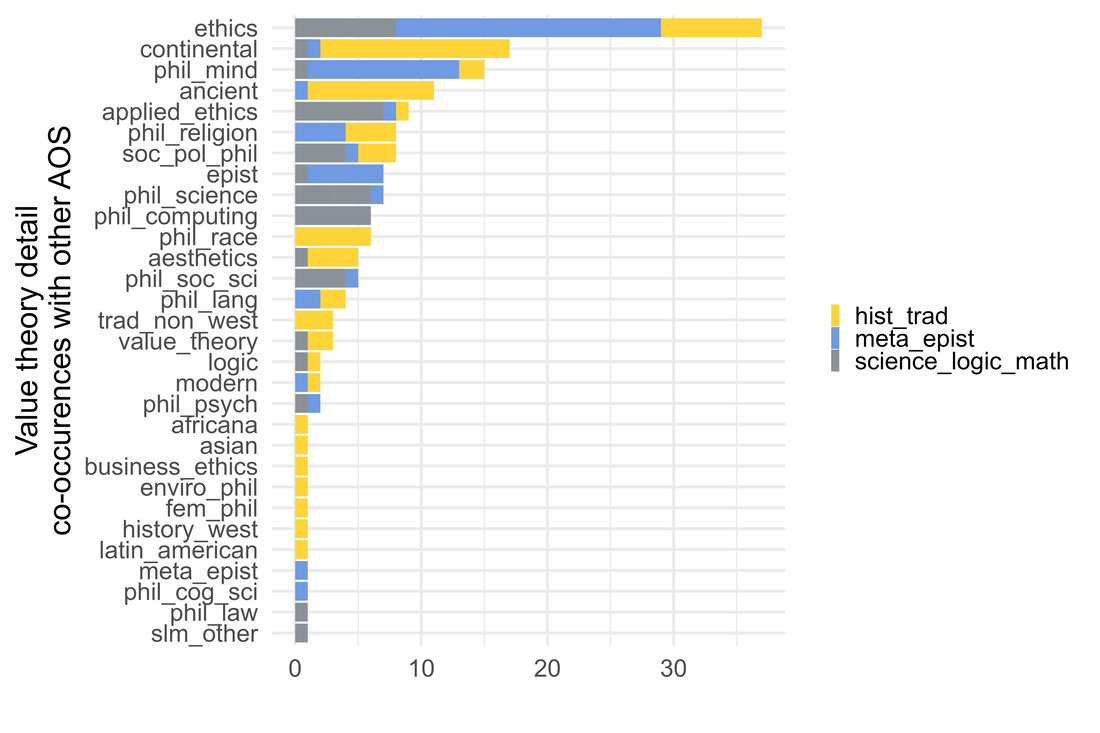 Here's how to interpret this plot: each of the AOS's on the left appeared with an ad tagged "value theory." The colors are the other main AOS's that the keyword appeared with. For example, look at "philosophy of mind": when it appeared in ads tagged with "value theory," those ads were also tagged with history/traditions, metaphysics/epistemology, and science/logic/mathematics. Of those other tags, metaphysics/epistemology showed up most often. The big trends are interesting. Whenever "ethics" shows up in the context of other main AOS's, it's most often with metaphysics/epistemology. So one would expect that ethicists who also do some metaphysics or epistemology would be better positioned for these kinds of jobs than folks doing only ethics. Likewise, notice under "applied ethics" that it occurred most often with the main tag "science/logic/math." On reflection, this makes sense given the rise of ads looking for philosophers working in philosophy of tech and/or AI (discussed below). When "philosophy of race" shows up with other main AOS tags, it's exclusively with history/traditions. This reflects what we find in the data: ads looking for philosophers of race typically mention non-Western philosophy in the ad. History and traditions 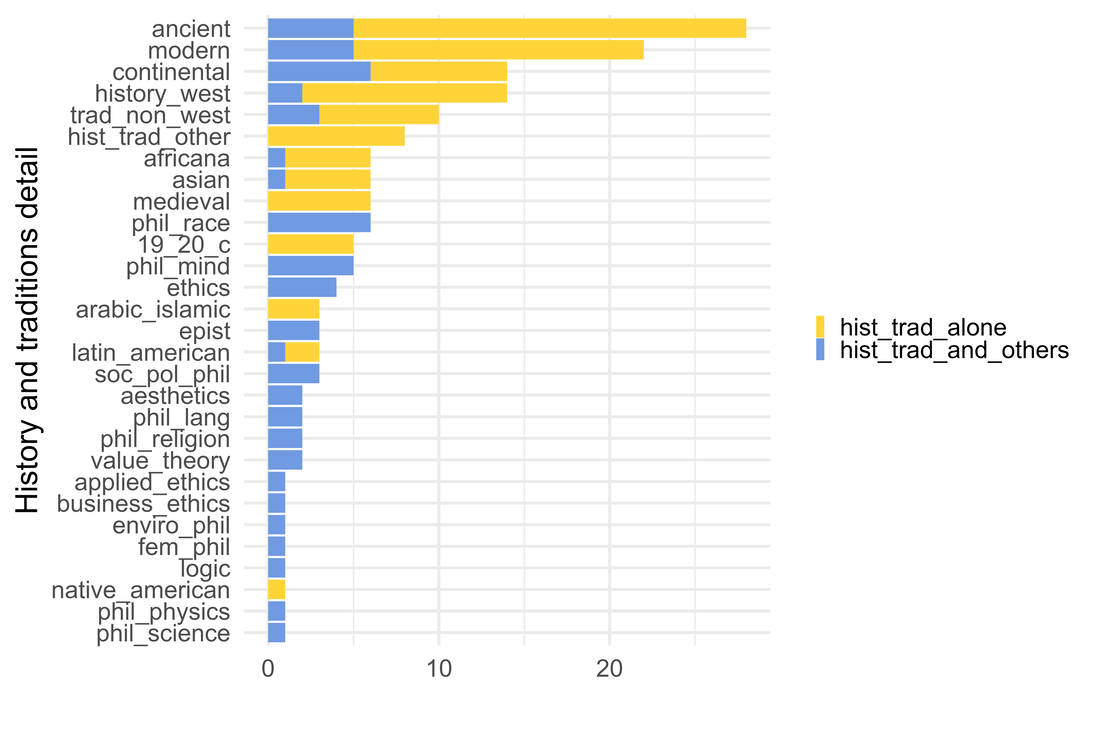 A word on the data: whenever an ad listed a string of non-Western traditions, I used the label "trad_non_west." This covers anything that isn't Western philosophy (including American and Continental). The only time I didn't use this tag for a string of non-Western AOS's is if there were only 2 or 3 members of the disjunction (e.g. "Latin American or Native American"). A few things of note. Ancient and modern are the most looked-for. Continental and the history of western philosophy are just about even. And fairly far behind is any kind of non-western tradition: Africana, Asian, Arabic/Islamic, Native and Latin American. Bringing up the rear for traditions, we find Native American and Latin American. Now, they're included under the generic "non-western" label, so not all hope is lost. The prudent interpretation is that departments in the last year are more interested in Native American and Latin American as members of non-Western traditions rather than as traditions in their own right. Out of curiosity, let's compare tags for Western philosophy vs non-Western. 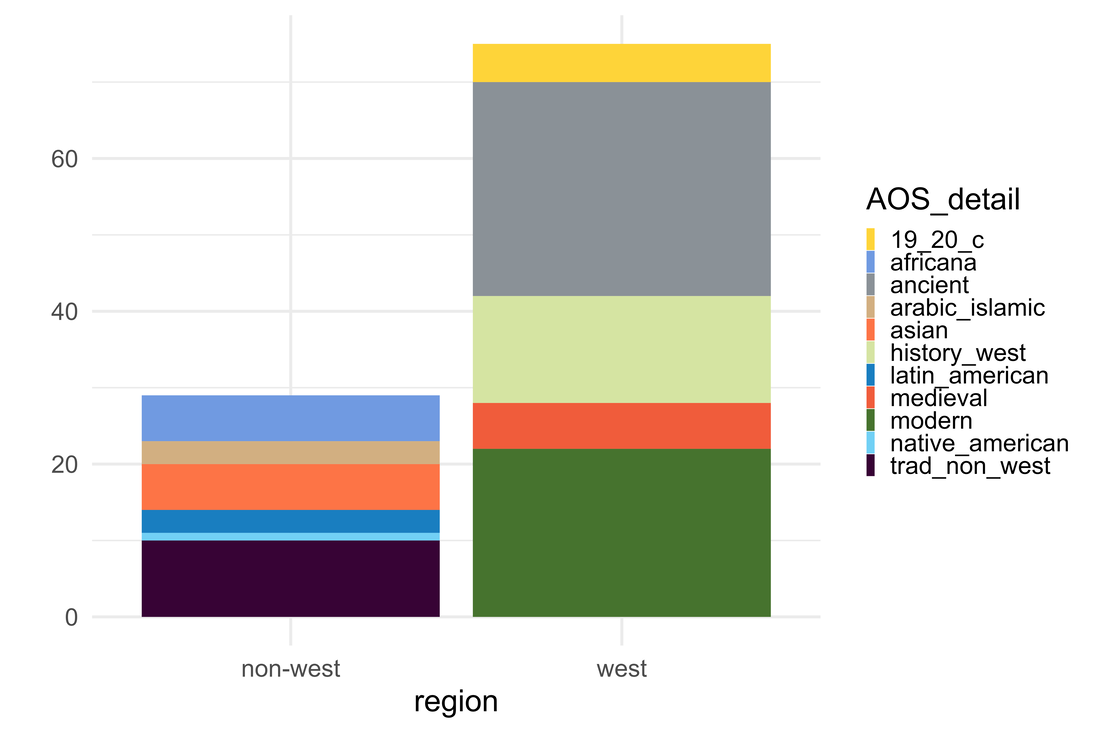 There are a lot more ads mentioning Western philosophy (75) than non-Western (25). The lion's share of non-Western tags are for anything in a non-Western tradition. Native American philosophy appeared once last year. So while non-Western traditions are appearing more and more on the contemporary scene (e.g. Chalmers's book Reality+, Peter Adamson's fantastic podcast), they're still lagging far behind in job-ad mentions. Now to look at history/tradition filtering out any ads that included other main AOS's: 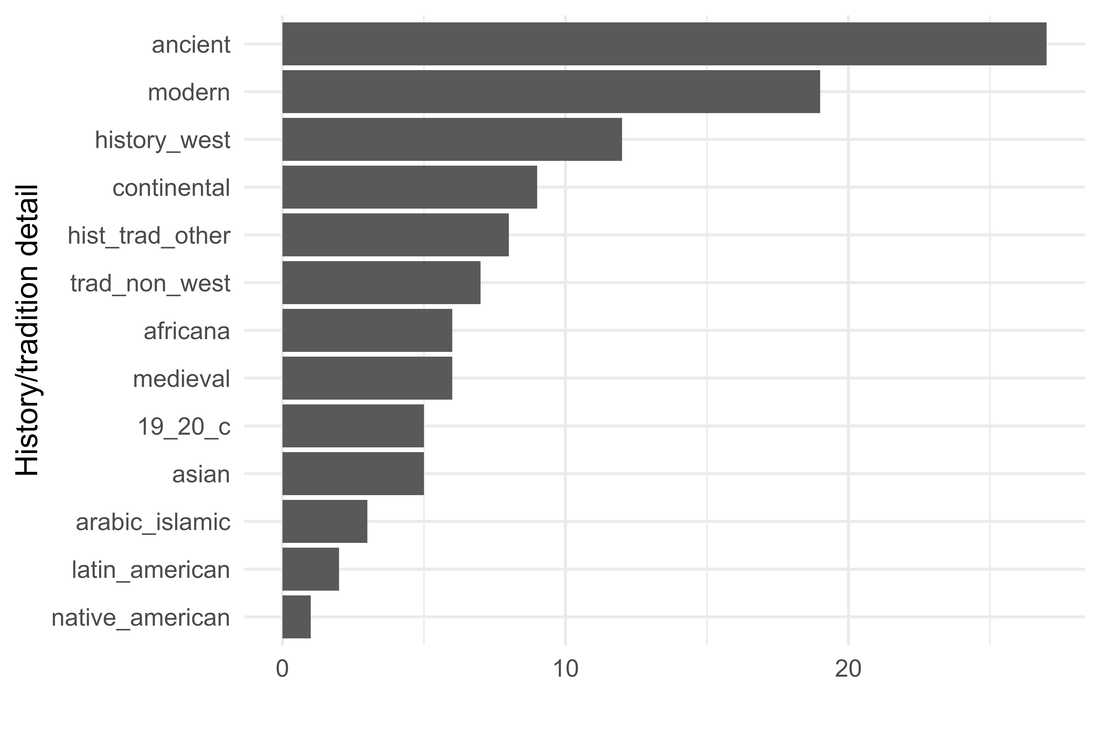 Looking at history/traditions detail AOS, where only "value theory" is the main AOS, we see the history of Western philosophy is most advertised-for: either ancient, modern, or just in general. Ads under "hist_trad_other" include detailed AOS's that don't fit neatly under any other history/tradition category, like Kantian, post-Kantian, phenomenology & history of philosophy, and digital humanities. Now let's look at history and traditions where they appear with other main AOS's. 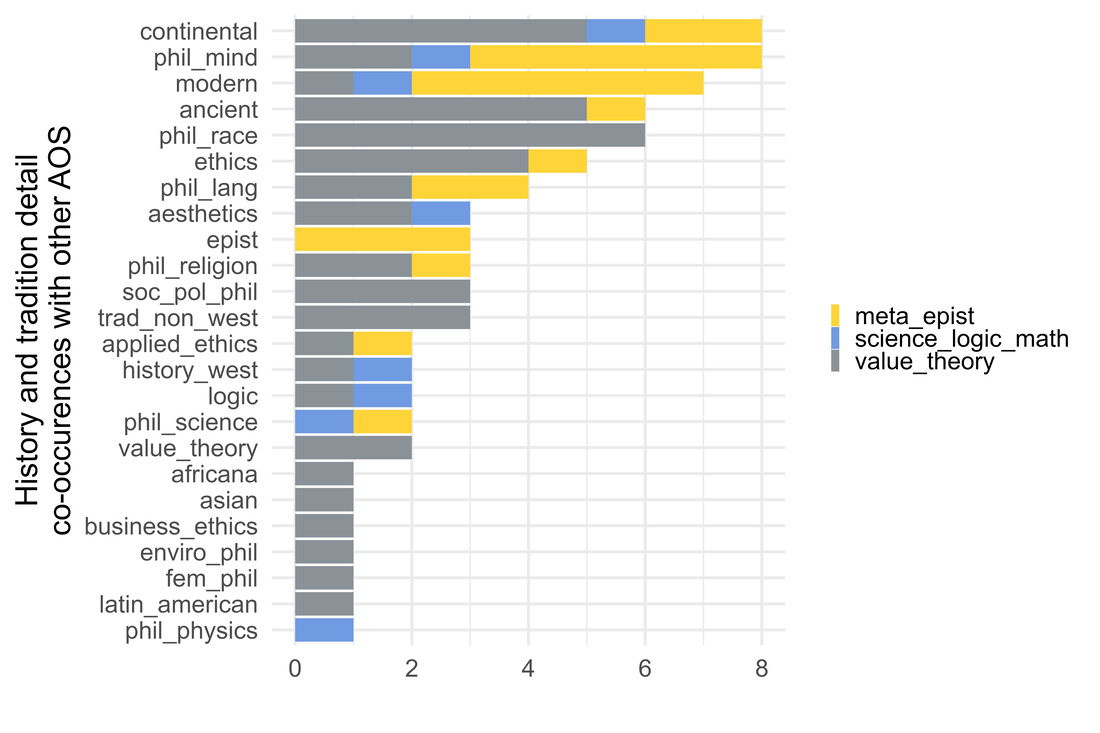 First, notice the relatively small number of mentions: history and traditions don't typically show up with other main AOS's. Here's a noticeable trend: history/traditions ads, when they appear with other main AOS's, are typically coupled value theory (21). It doesn't seem that departments are looking for history/tradition (8) or metaphysics/epistemology (10) alongside someone doing something in science, logic, and math. Science, Logic, Math The big picture: 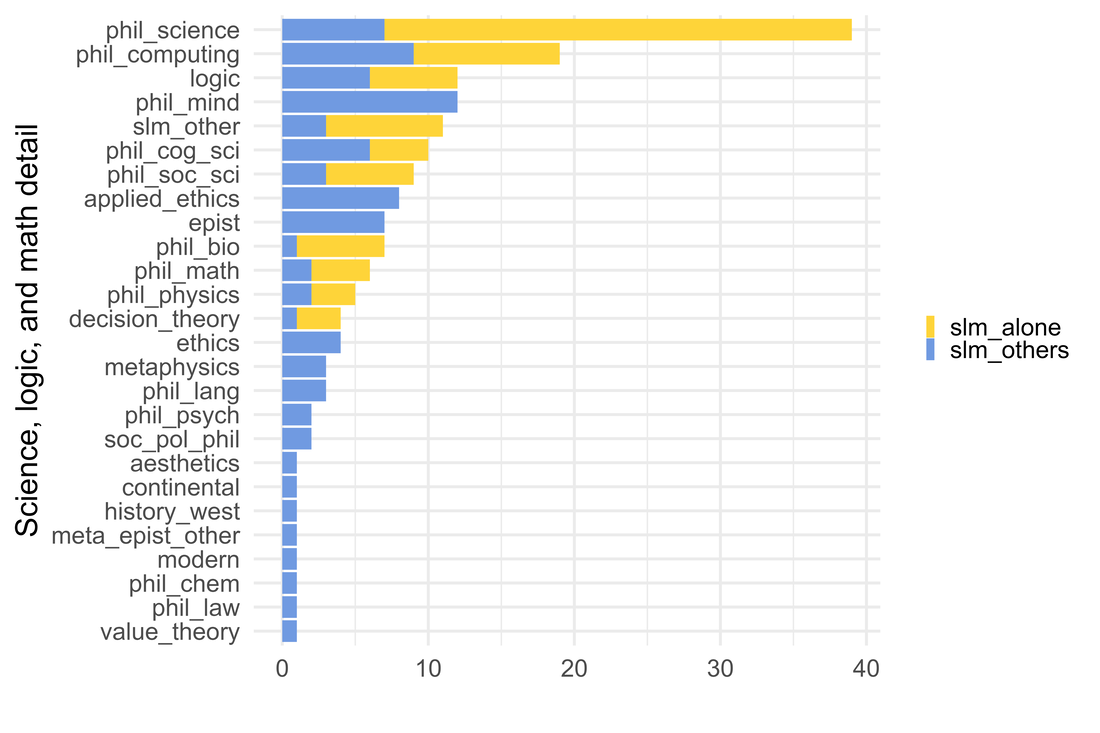 Phil science dominates. Under "slm_other" we find ads for philosophy of AI, science and technology studies, complexity/emergence, and technical methods (e.g. agent-based modeling). The least sought-after specialization in this subfield is decision theory. But it's not as though philosophy of cognitive science or philosophy of social science are exactly dominating either. 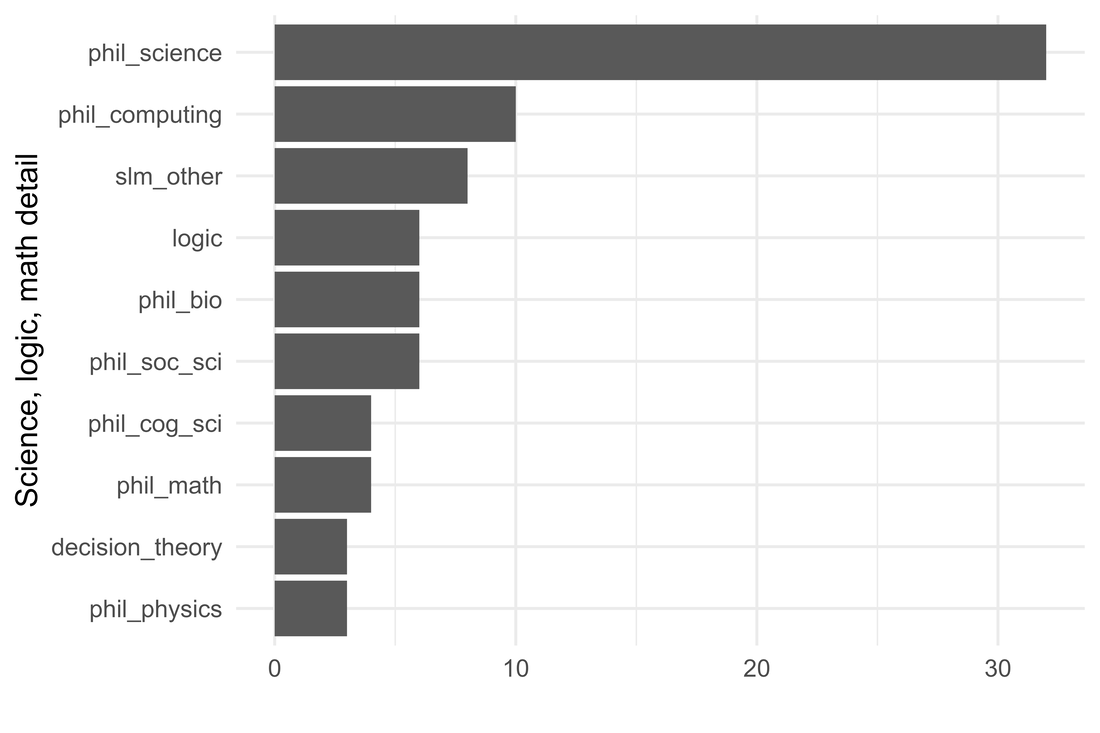 Philosophy of science dominates, but as David Wallace pointed out in a comment on Daily Nous way back when, other specializations can apply for philosophy of science jobs. But again, we're looking at trends here and not necessarily numbers of jobs, and it's worth noting that more departments are looking for philosophers of science rather than philosophers of some particular science. 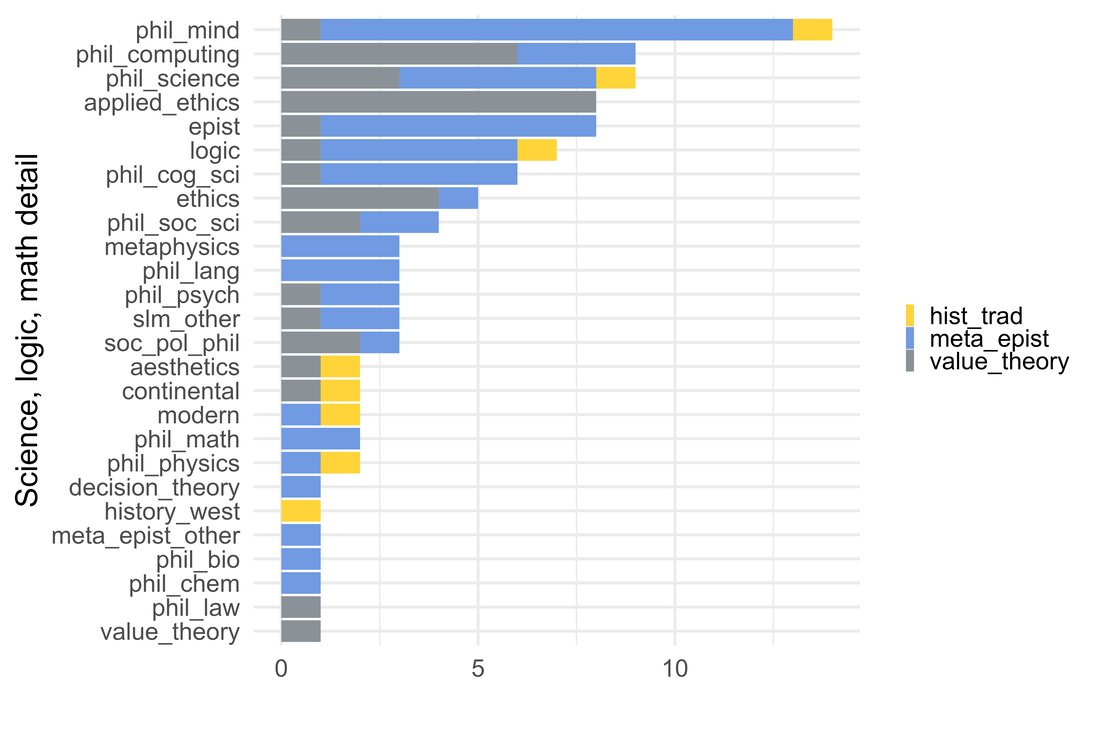 When science/logic/math ads appear with other main AOS's, metaphysics/epistemology dominates (59), with value theory trailing (35), and history/traditions a distant third (8). Something of note: there is a sizable number of co-occurrences of philosophy of computing with "value theory" tags and there are quite a few "applied ethics" showing up with science/logic/math ads. A lot of this can be chalked up to burgeoning interest in ethics of technology and AI. Let's dig into that. This table tells us how often "AI" and/or "technology" appeared with each of the main AOS's since July 2022 (i.e. the last job cycle). 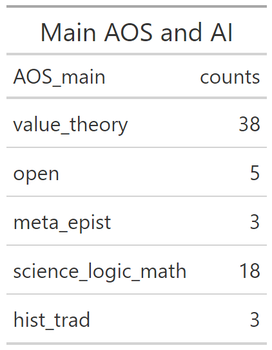 (If you're wondering about "open", those are ads that had an open AOS but tech/AI for AOC.) By and large, departments looking for philosophers of tech/AI are looking for ethicists rather than folks working on (say) computing theory and AI or epistemology and AI. Now for the historical perspective. For this last job cycle, 54 ads had "AI" or "technology" appearing in either the AOS or AOC description. (AOC is included because some AOS were value theory but the AOC explicitly mentions technology or AI.) Let's take a look at this by calendar year 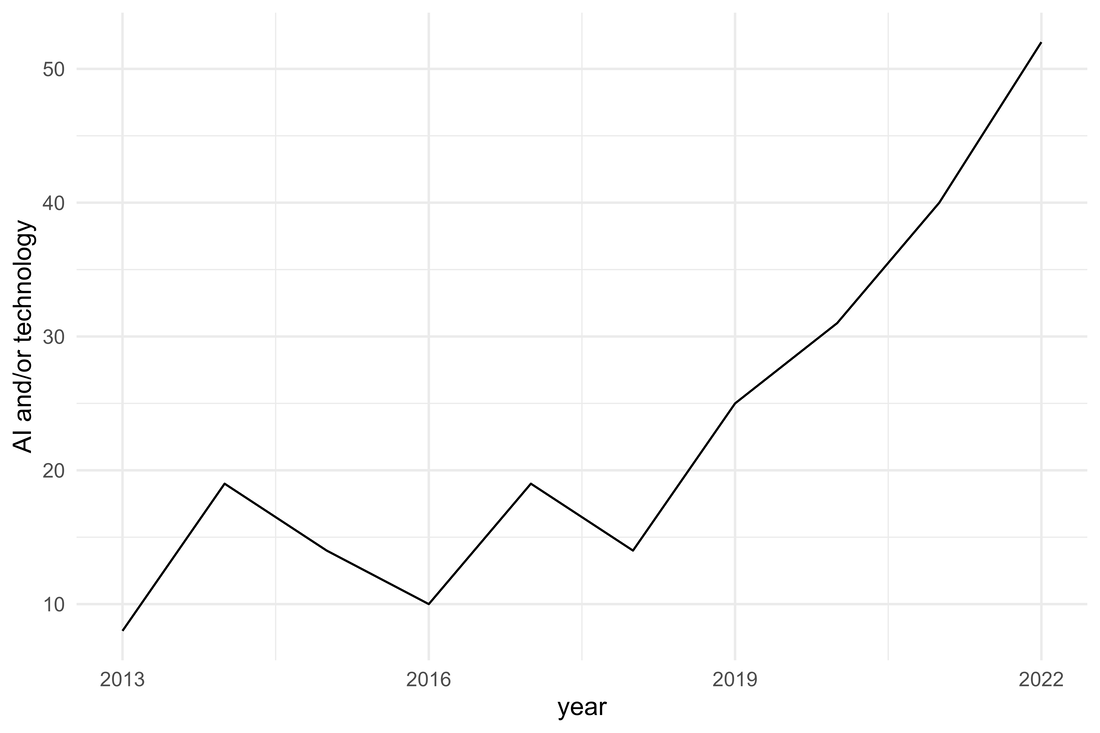 Clearly, ads for philosophy of technology and/or AI are increasing steadily. Who knows when it will plateau? Of course we don't want Disco Stu projections...  ...but it seems like phil of tech/AI is here to stay. Metaphysics and epistemology Last but not least: metaphysics and epistemology. First, the big view: 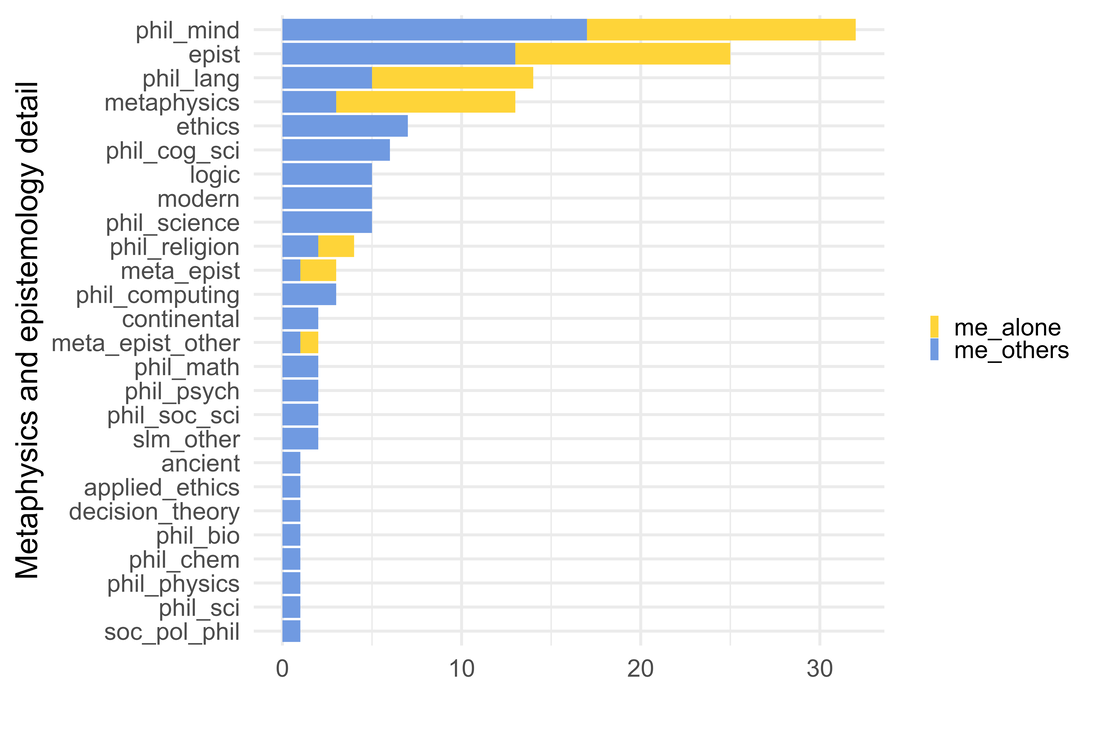 Now let's dig into M&E ads without any other main AOS's: 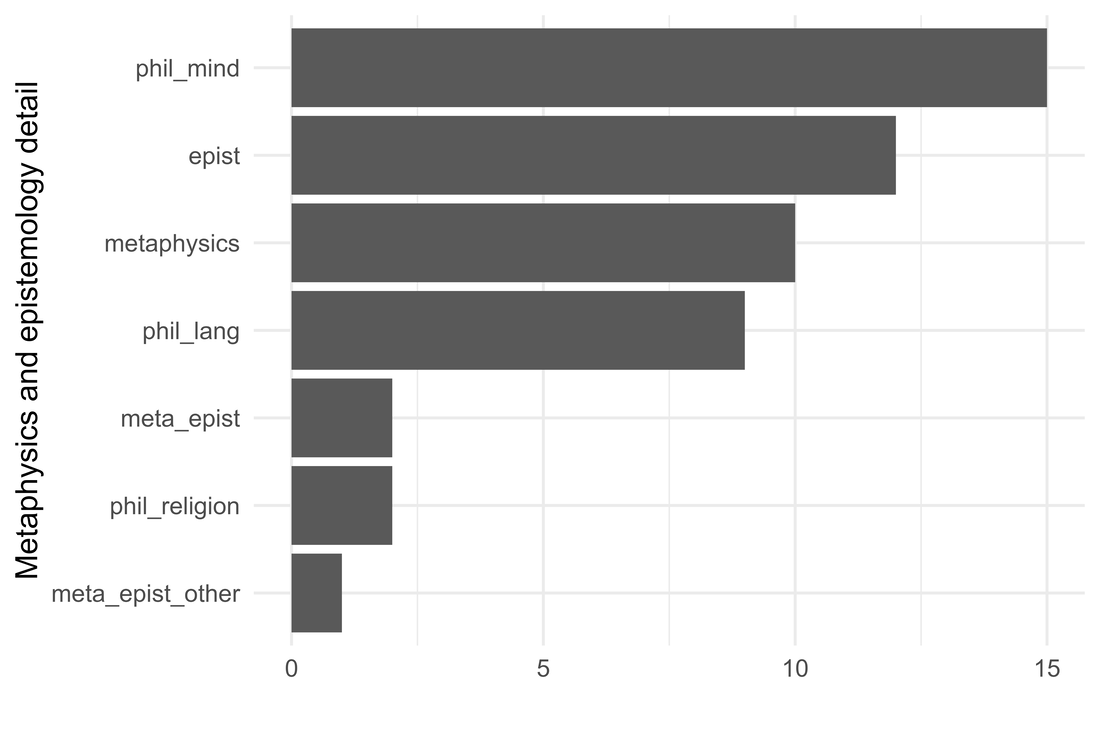 Well well well....looks like we found our LEMMings. Under the "other" tag, we have (i) an ad looking specifically for a social epistemologist and (ii) an ad for the epistemology and/or cognitive science of religion. (And the "meta_epist" tag is where the ad's AOS was "metaphysics or epistemology.") 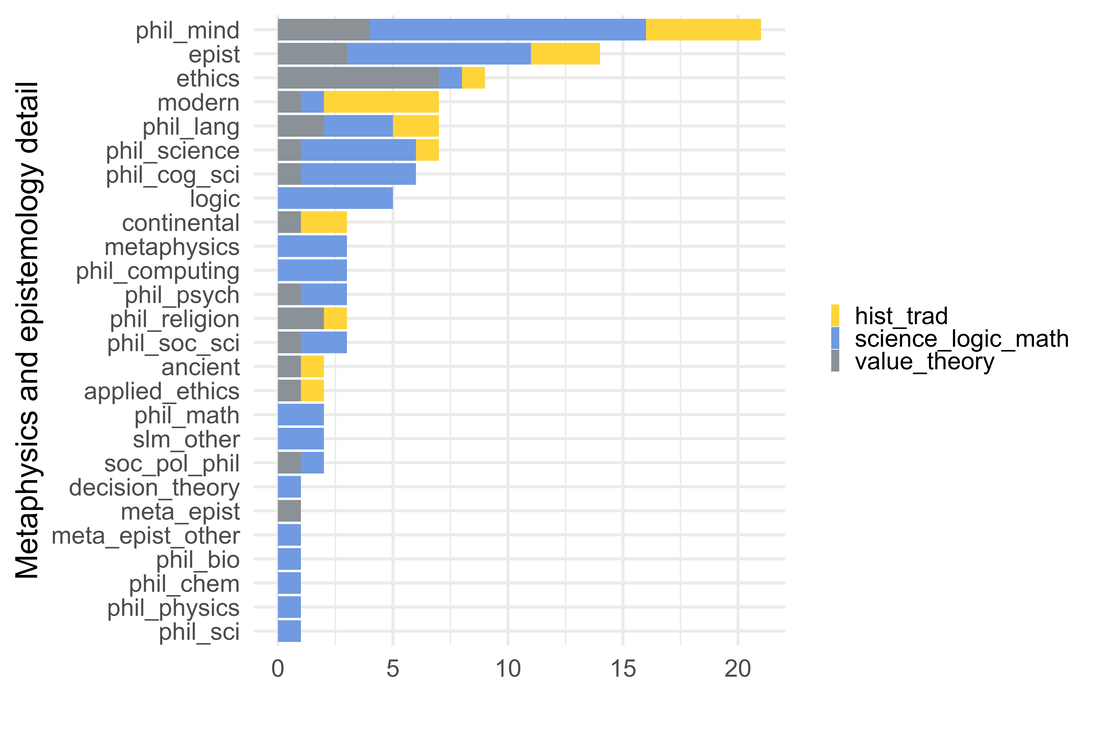 Of those ads featuring M&E, they occur more often with science/logic/math (22) and value theory (16) than history/traditions (11). concluding thoughts So what can we conclude from all this?
First, in comparing solo main AOS with multiple main AOS in ads, only metaphysics/epistemology has fewer solo instances than joint instances. This suggests that metaphysics/epistemology is sought after but mostly in conjunction with other areas (e.g. mind and cog sci or epistemology and philosophy of science). There was less demand this year for straight-ahead metaphysics/epistemology. Second, non-Western traditions weren't all that sought after this last year compared to Western traditions. Third, philosophy of technology/AI is on the rise, particularly in connection with moral questions. That's all for now. If you have any suggestions or analyses you'd like to see, please email me Hi friends! Now that we're in the dog days of summer, it's time to look at the job market for the secondary cycle. (Friendly reminder: the primary cycle runs July to December; the secondary cycle runs January to June.) We'll look at the numbers and focus on a couple of interesting trends. First up, let's look at the volume of jobs posted for each of the job types on Philjobs. 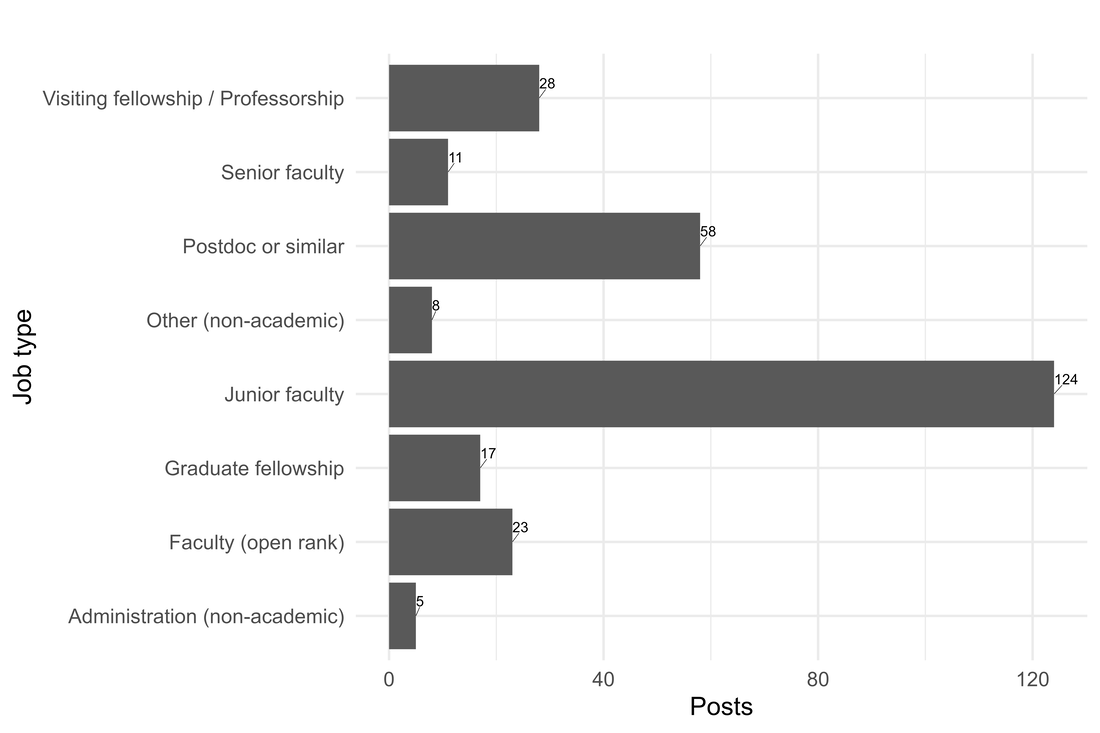 As you might expect, junior faculty and postdoc jobs are the most prevalent, followed by visiting and then open rank. But lets put this in historical context. 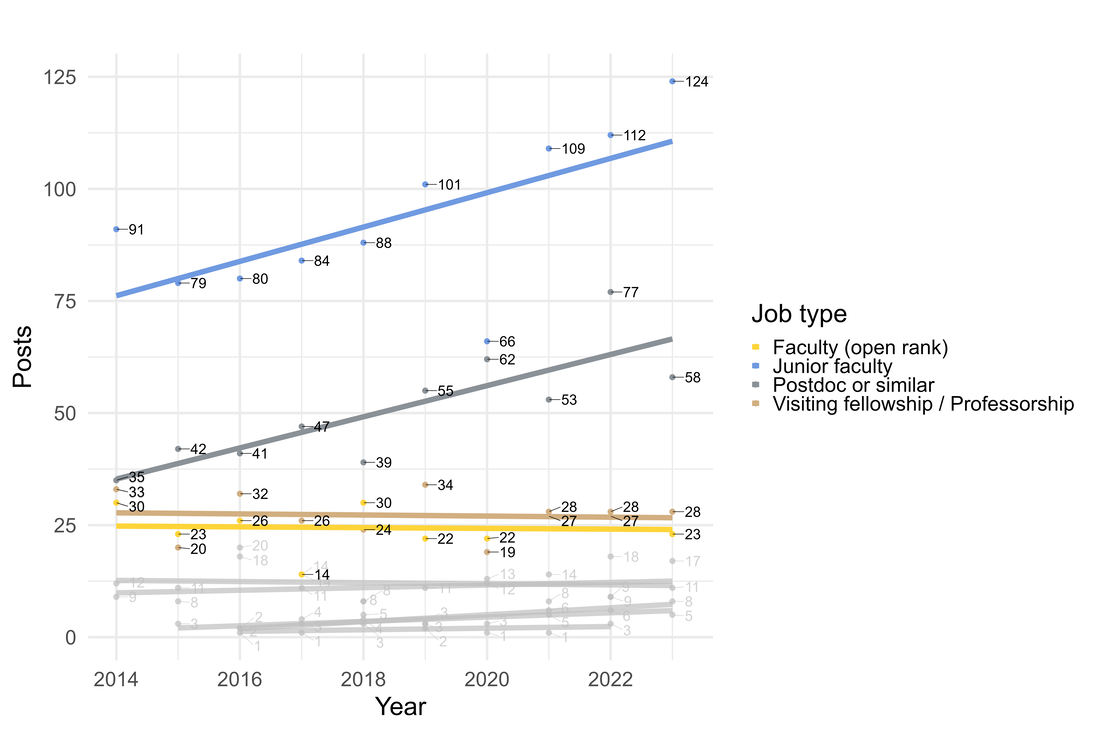 The colored lines had, at least once, at least 25 postings in a secondary cycle. So this is heartening: ads for both junior jobs and postdocs have been going up over the last decade. Huzzah! All other jobs have either declined slightly or stayed flat. Let's zoom in on junior jobs 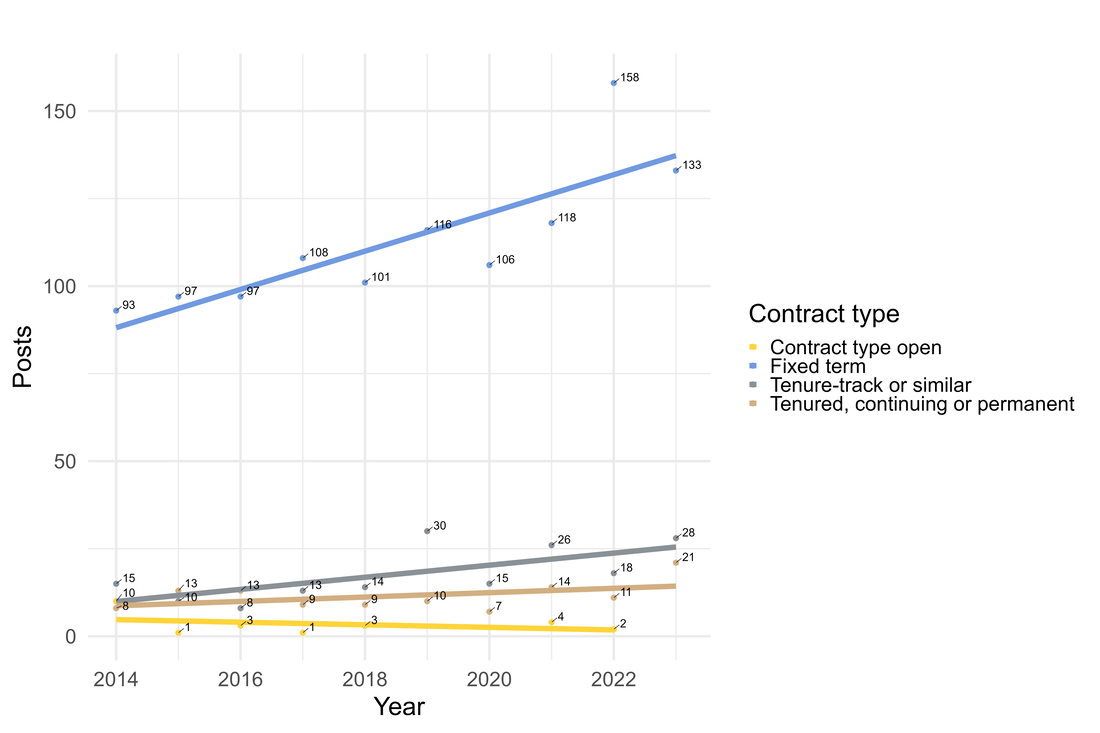 This is less heartening, but probably expected. Fixed-term jobs are increasing annually at a faster rate than tenure-track jobs. Again, this is for the secondary cycle--I think received wisdom is that fixed-term jobs are more prevalent here than in primary cycle. So let's check the data for this. (BTW we're more interested in general trends now, so I'm going to drop annotating the lines with numbers.) 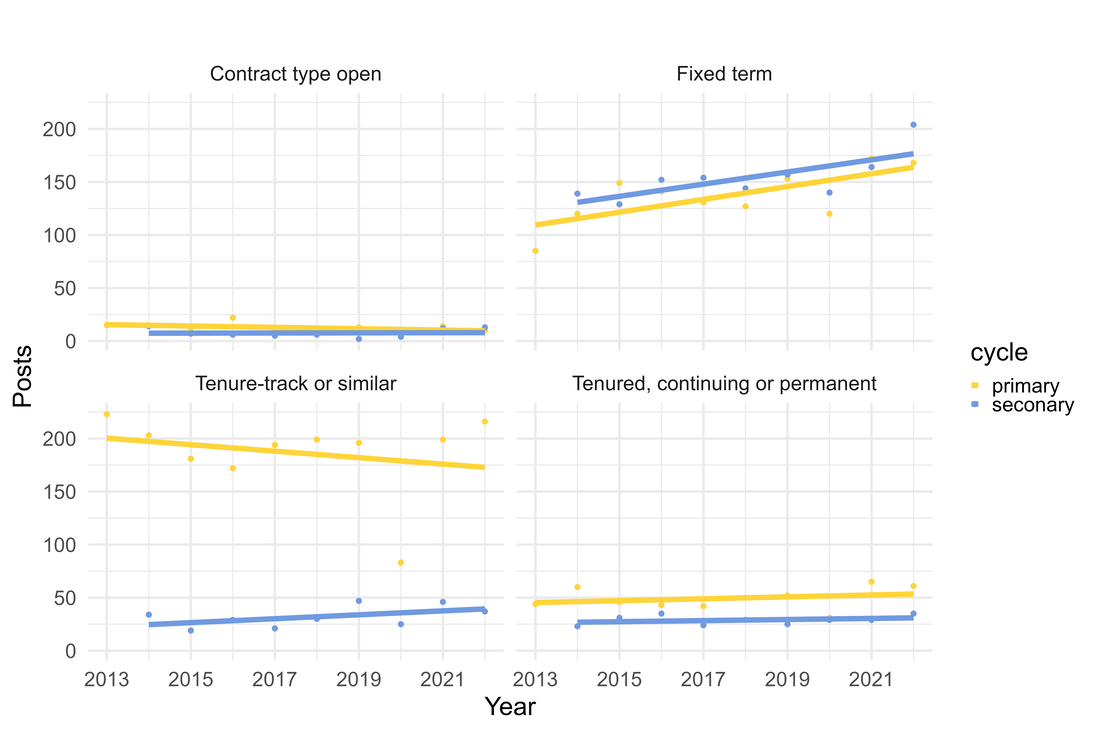 What we have here breaks out jobs by: (1) year, (2) cycle, and (3) contract type. This confirms our earlier suspicions: more TT jobs are posted in the primary than the secondary cycle and slightly more fixed-term jobs are posted in the secondary cycle. But there's something odd here: the trend line for TT jobs for the primary cycle is decreasing while the trend for fixed-term jobs for both cycles is increasing. This suggests that there are fewer TT jobs and more fixed-term jobs as time goes by. Let's check this. First, we're going to exclude 2020--that was a terrible year for the job market and perhaps that's dragging the TT primary cycle trend line down. 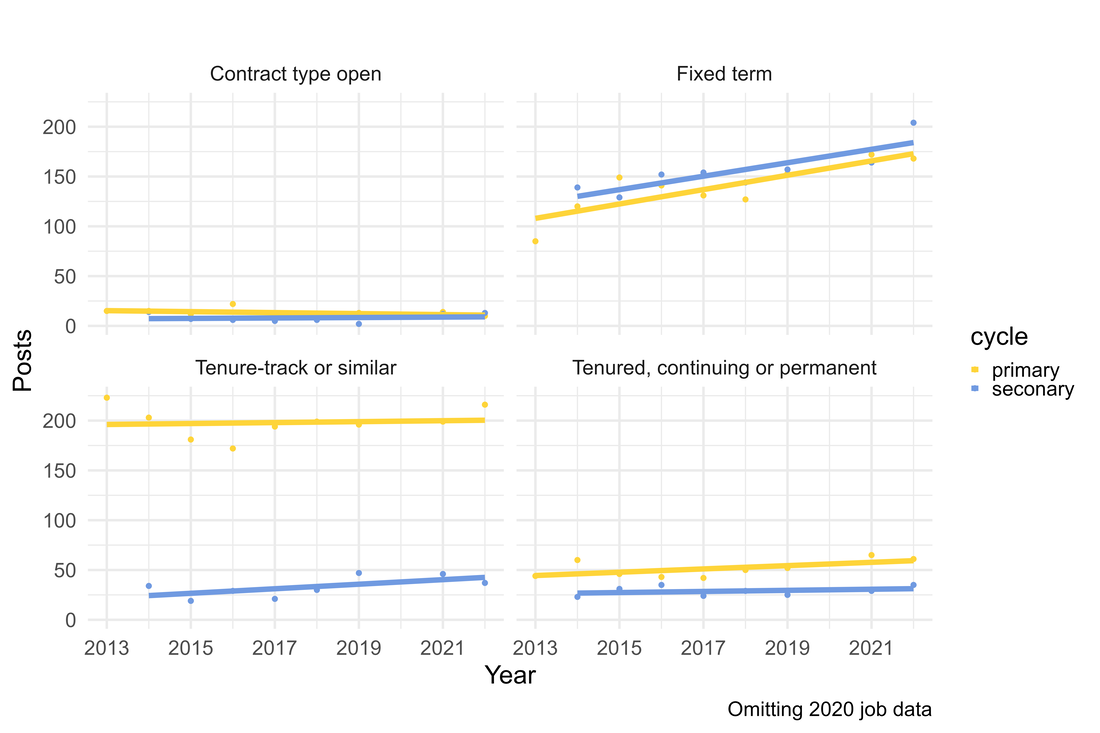 That's not much comfort. Excluding the worst year for the market since 2008, TT jobs tend to stay steady while fixed-term jobs increase. Another possibility is that the trend lines are affected by the number of jobs posted each year. More fewer posts means fewer TT and fixed-term jobs. Maybe scaling TT and fixed-term jobs to number of posts tells a different story? 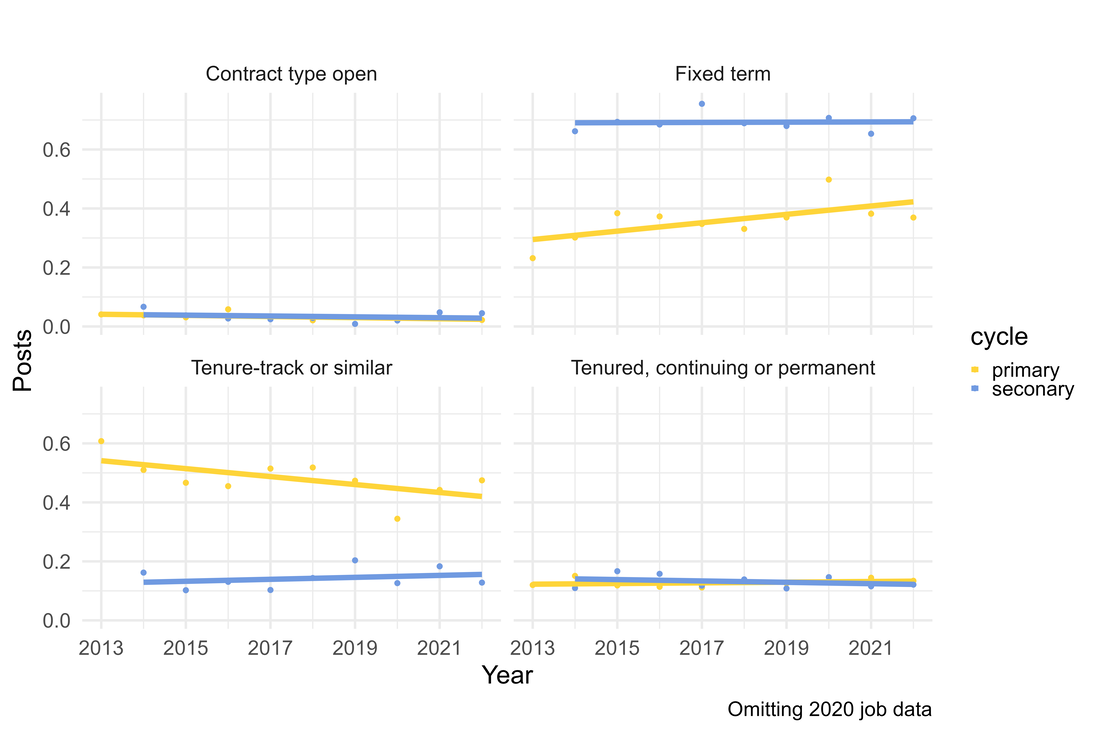 Ok so the story here looks slightly worse. Relative to all postings in a year, there are progressively fewer TT jobs and more fixed-term jobs for the primary cycle. Fixed-term jobs remain relatively stable for secondary cycles over the last decade while TT jobs are increasing slightly during second cycles. Let's switch back to raw (instead of relative) counts for a moment and look at fixed-term and TT jobs by cycle. 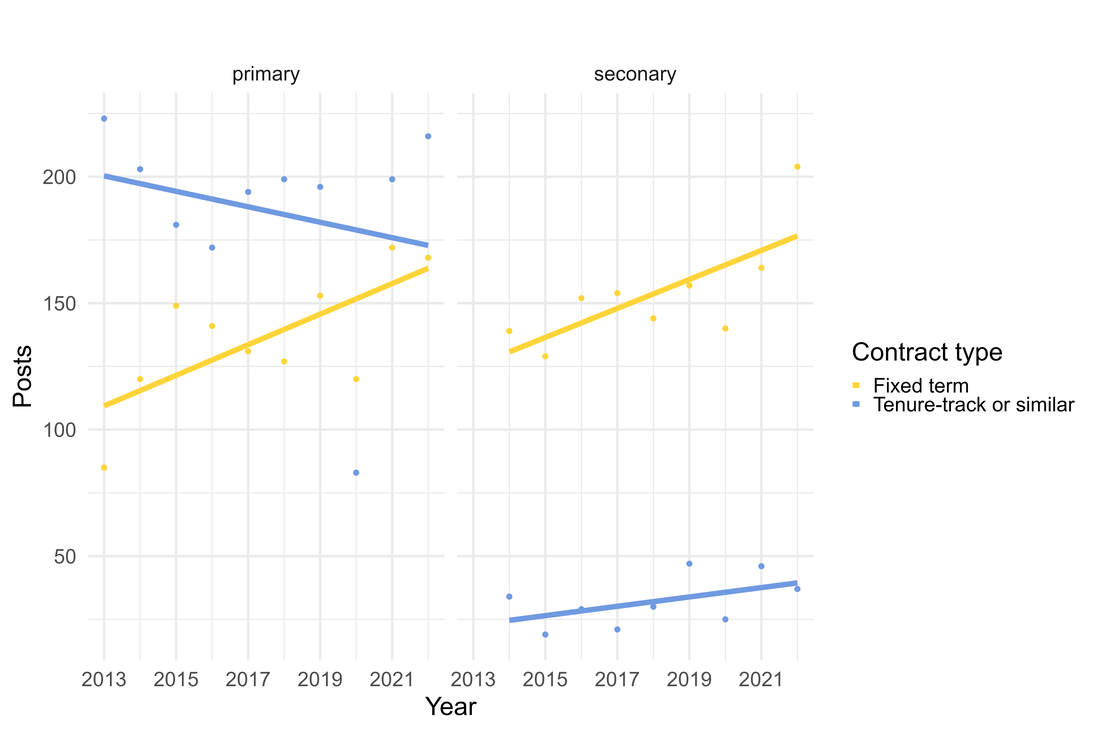 Indeed the trend seems to be fewer TT jobs and more fixed-term jobs advertised in the primary cycle. I'm as much of a Pessimistic Paulie as the next philosopher, but maybe, maybe there's reason for a guarded optimism. Take a look at the trends in the differences between TT and fixed-term jobs advertised by year and cycle. 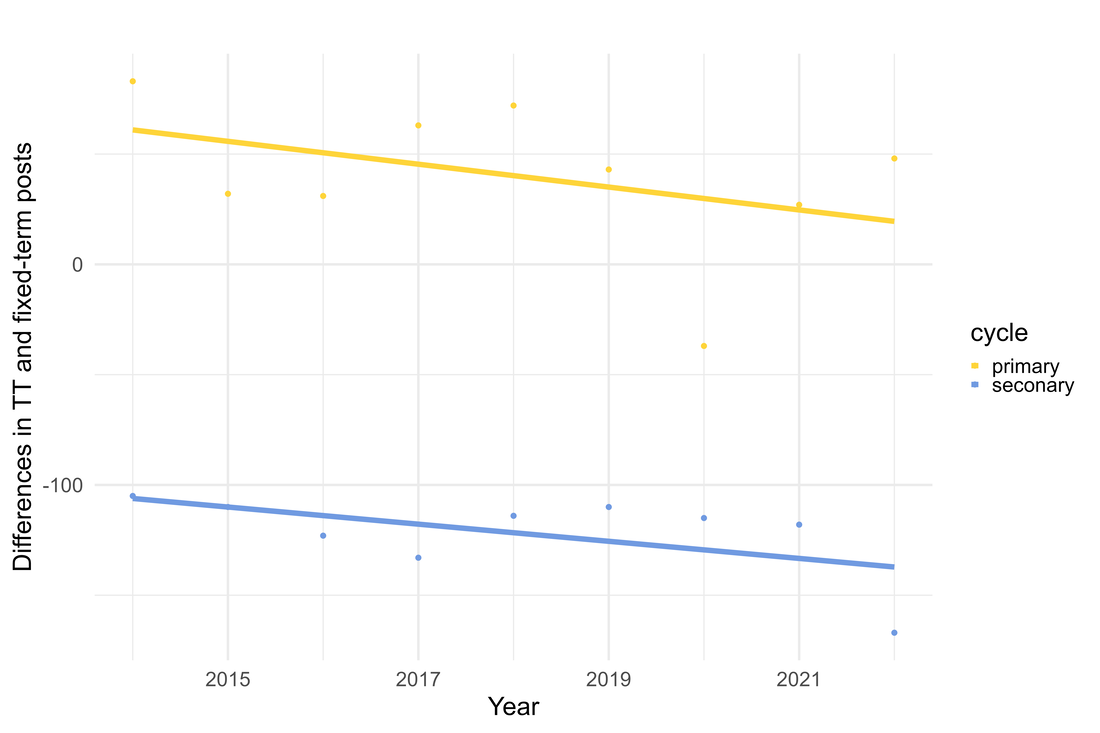 This suggests that, over the last decade, the differences between the number of TT and fixed-term jobs generally decreases. What can we conclude from all this? First, we shouldn't expect the number of fixed-term jobs to overtake the number of TT jobs, at least not in the near future. Second, this is consistent with more fixed-term and fewer TT jobs advertised. (Note that this does not include adjuncts. It's hard to find reliable data (or any data, for that matter) on adjunct positions.) The safe bet is this: there will continue to be fewer TT jobs and more fixed-term jobs in the near future, but long term there will continue to be more TT than fixed-term jobs. At least, that's the hope.
That's all. If you have any other analyses you'd like to see, please let me know! I've posted the data and code for these analyses under the "Blog Data" tab. Justin Weinburg kindly shared the post from yesterday. I think he raises some good questions. There's one thing I didn't mention in the post that I think is worthwhile. Sentiment analysis goes word-by-word, and the dataframe I was working with had more than 37,000 words. So the results wouldn't be skewed by a few hundred negative words...at least not the negative words that were in the data. It would have to be a fair number of "motherfucker"s to really make a difference. And that's, to my mind, the power of sentiment analysis. It offers a birds-eye view of sentiment made up by the contributions of tens of thousands of terms. There's no single article or term that causes the downward trend. It's a reflection of a wider cultural attitude.
Hello! I'm Charlie Lassiter. You may remember me from such blog posts as "The Job Market: We're All Doomed!" and "What Does Brian Leiter Blog About?" I'm here today to help answer the question, "what are newspapers saying about philosophy?" This was inspired by my colleague Mark Alfino, who keeps tabs on trends in higher ed. I says to myself I says, "I wonder how academic philosophy is talked about in newspapers?" I'm typically worried by articles like this one from Axios. And while I plan to get to online sources soon, newspaper turned out to be the easiest to tackle first. I used LexisNexis to get all American newspaper articles from the last 10 years mentioning "philosophy." To make sure I was getting returns on academic philosophy instead of the makeup brand or things like "her investment philosophy is...", I first filtered by "liberal arts" and then by "philosophy." Also, I limited the search to national and local newspapers. This means leaving out Chronicle of Higher Ed as well as some other higher-ed-specific sources. This gave me a batch of 686 articles. After that, I filtered out obituaries; they were throwing off the results. From here, I used the fantastic package LexisNexisTools to parse out the data and metadata. Seriously, if you do text mining in newspapers with R, I can't recommend this package enough. Text mining was done with Tidytext. Today we're going to do some sentiment analysis. Sentiment analysisSentiment analysis is exactly what it sounds like: getting an analysis of the positive and negative sentiments in a text. There are a few different ways to do this. The AFINN corpus from Finn Arup Nielsen tags words with a value between -5 ("bastard", "motherfucker") and 5 ("outstanding", "superb"), excluding 0. We'll be using that. Nielsen assigned these tags by hand and then checked his ratings against other corpora. You can find his paper discussing methodology and validation of his ratings here. I like it because it gives some nuance between bivalent "positive" and "negative" assignments, like you find with Bing Liu's lexicon. A good first step is looking at the distribution of values. 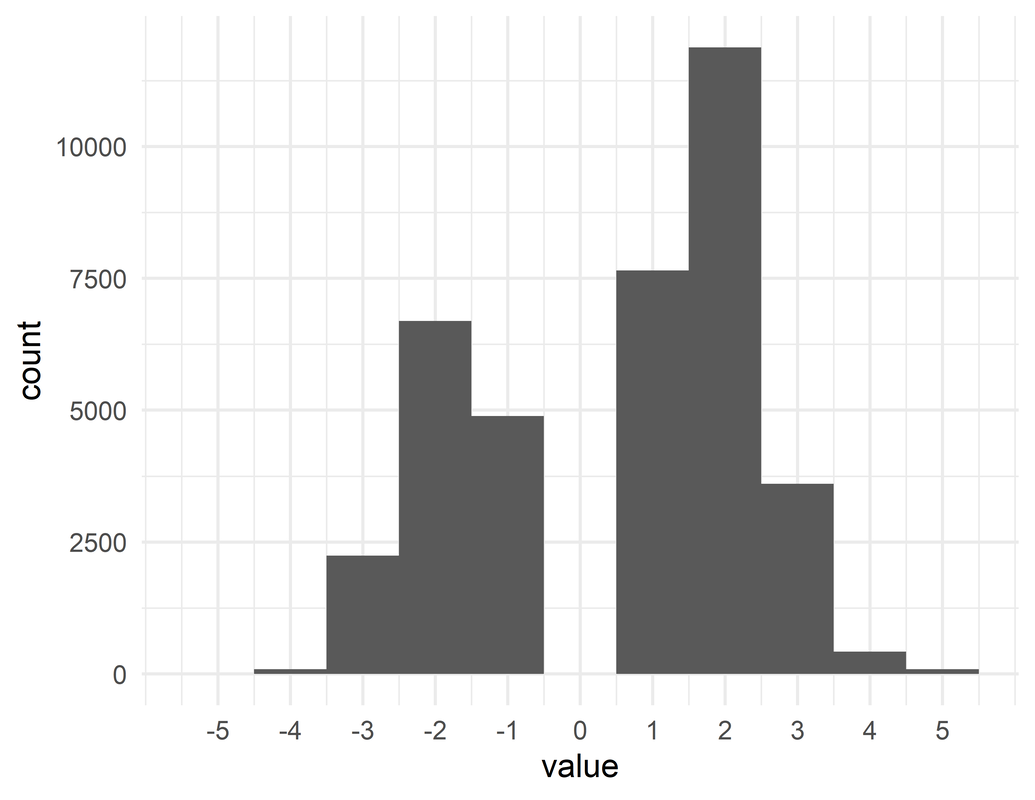 We see lots of 2 and 1 followed by -2 and -1. So more positive than negative and nothing really extreme. So far so good. Now let's look at sentiment over time. Using the AFINN corpus, I added up the values of the tags for each article by year. The problem, though, is that this could be affected by the number of words published in a year. More words could mean more positive things written, but if (let's say) 2012 had fewer words written on academic philosophy than 2022, then just plotting totals per year would make it seem as though 2012 was less positive than 2022. So I addressed this by scaling the total sentiment score to the number of words written: i.e. Score = Sum(Sentiment score per year) / Sum(Words published per year). That's what we find in this plot: 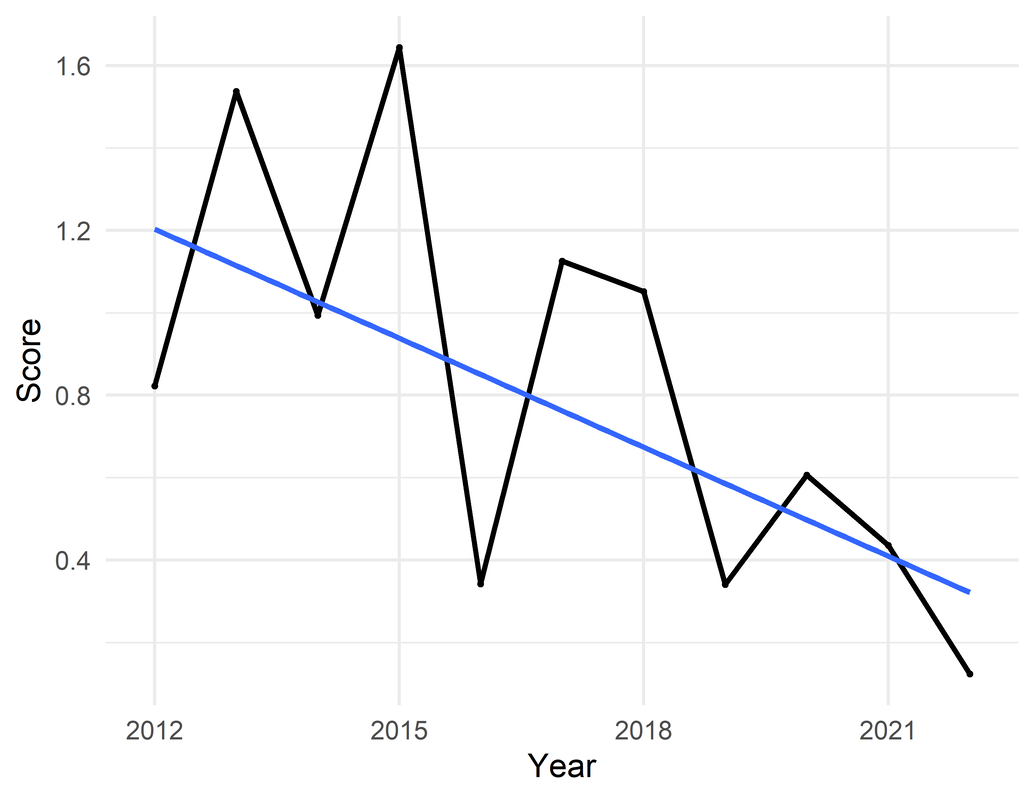 Notice that the scores are all positive--that means that, on the whole, academic philosophy is being reported using more positive than negative language in newspapers. But also notice the downward trend over the last 10 years. We're being talked about less positively as time goes on. In 2022, for instance, the New York Times ran an article "At the Edge of a Cliff, Some Colleges Are Teaming Up to Survive." And Moneywise ran "How to Build a University Unafraid of True Intellectual Diversity." These are, on the whole, positive but there's quite a bit of negative in them too. Compare that with "We Need More STEM Majors with Liberal Arts Training" from the 2015 Salt Lake Tribune and "UW's Liberal Arts Grads Finding Work," from Wisconsin State Journal. What might explain the sharp dips from 2015 to 2016 and 2018 to 2019? I'm just taking a guess here, but the presidential race from 2016 might have a lot to do with it. There was quite a lot of "enough with the eggheads" talk. And 2019 was...well...COVID and the economic pressures that came along with that. Let's look at individual newspapers now. We're using the same scoring method of scaling sentiment by number of words written--but now by newspaper. 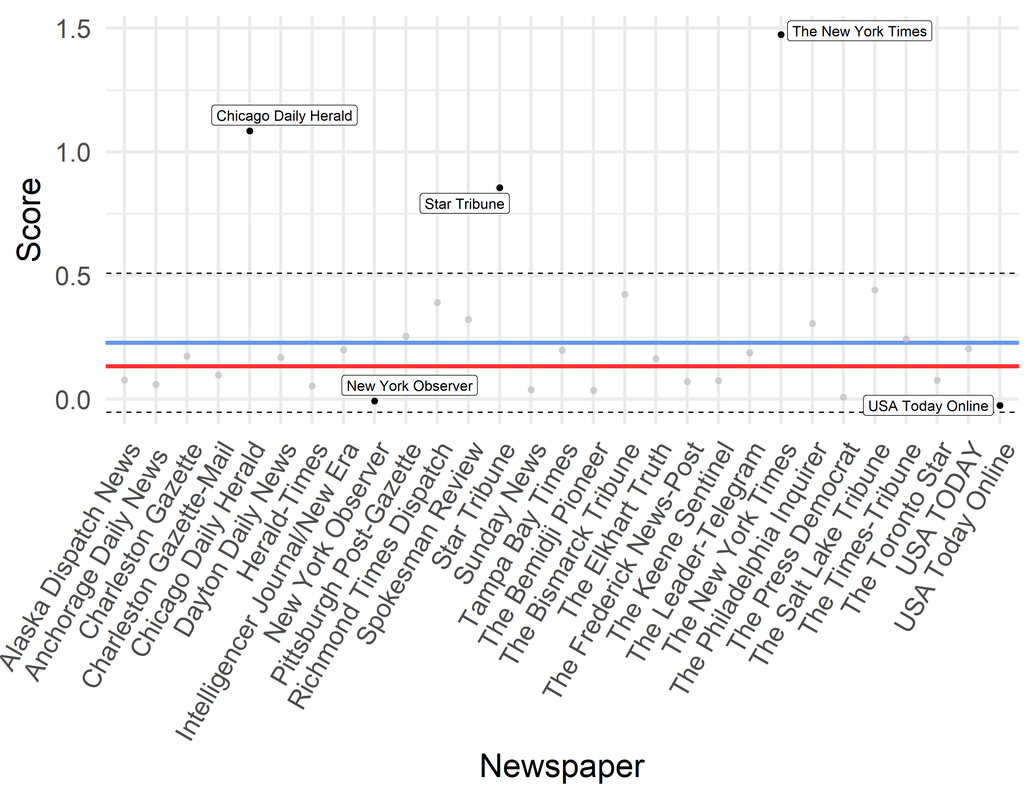 I only included newspapers that had articles totaling more than 1000 words on academic philosophy over 10 years. The blue line is the average score of 0.281. The dashed lines are the standard deviation. The red line is the median score of 0.133. The newspaper to write most favorably about philosophy is the New York Times. I don't suppose that's a huge surprise; they did have The Stone after all. The outlet to write least favorably is USA Today Online along with the New York Observer. Both these outlets had negative scores, which means they put out more negative sentiments than positive ones. Most outlets are lukewarm in their reporting about philosophy, it seems, but most are below average. This is probably due to the three points waaaaay north of the standard deviation throwing off the average. The median is more representative of the bigger picture. But how do we interpret it? Recall that the AFINN corpus uses a scale of -5 to 5 to rank the sentiment of a term. And these scores are scaled to the number of words written. So if we find values close to 0, then it doesn't matter how many words are written--there are about as many positive sentiments as negative ones. This is what the median tells us: that, relative to the number of words written, there are slightly more positive sentiments than negative ones. The Alaska Dispatch News has relatively fewer positive sentiments than the Spokesman Review--which, I might add, is above both the median and the mean. Go Spokane! Whether the outlet ranks above or below a score of 0 tells us whether there are more positive or negative things said. USA Today Online, for example, could only get a negative score if there were more negative sentiments than positive ones. Note that this fits with sorts of intuitions primed by the histogram above. Well that's it for now. If there's anything else you'd like to see analyzed, let me know. And I'm making a zip file of the articles I used for analysis available here if anyone else want to play with them.
Hey all. I've been wanting to look at AOS's but it's a bit of a pain since the data has to get cleaned. No matter. It's done. Here's the big picture:
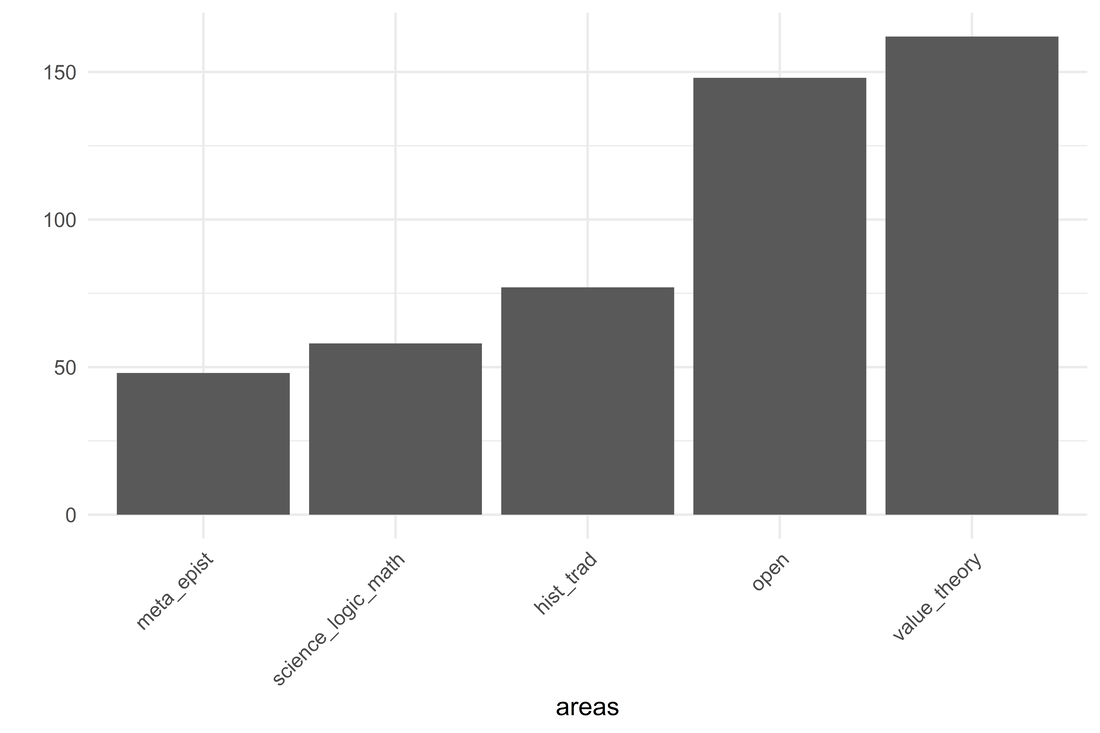
A note on method: In cases where multiple areas were listed, I've counted those separately. So this isn't a tally of all jobs on the market. Rather, it's a tally of all the jobs advertised in one of the five main categories on Philjobs. So (e.g.) there are a hair under 50 jobs in metaphysics/epistemology. But some ads listed meta/epist or history of phil as the AOS they were looking for. Here, each of those was counted separately. I opted for this method of counting because I'm assuming that any disjunctions in AOS's for job ads can draw from two different applicant pools: that is, that AOS pools are exclusive. (I know this isn't always true but go with it as a simplifying assumption for the model.) For (for instance) a job ad looking for an epistemologist or an ethicist gets listed here as a job for an epistemologist and as a job for an ethicist. So if Jack is an epistemologist and Jill is an ethicist, the job ad counts as a listing for Jack and for Jill individually. In a nutshell, I'm counting jobs by AOS from the point of view of job seekers under the assumption that multiple AOS's have mutually exclusive candidate pools.
Let's zoom in on a few of these, starting with value theory. 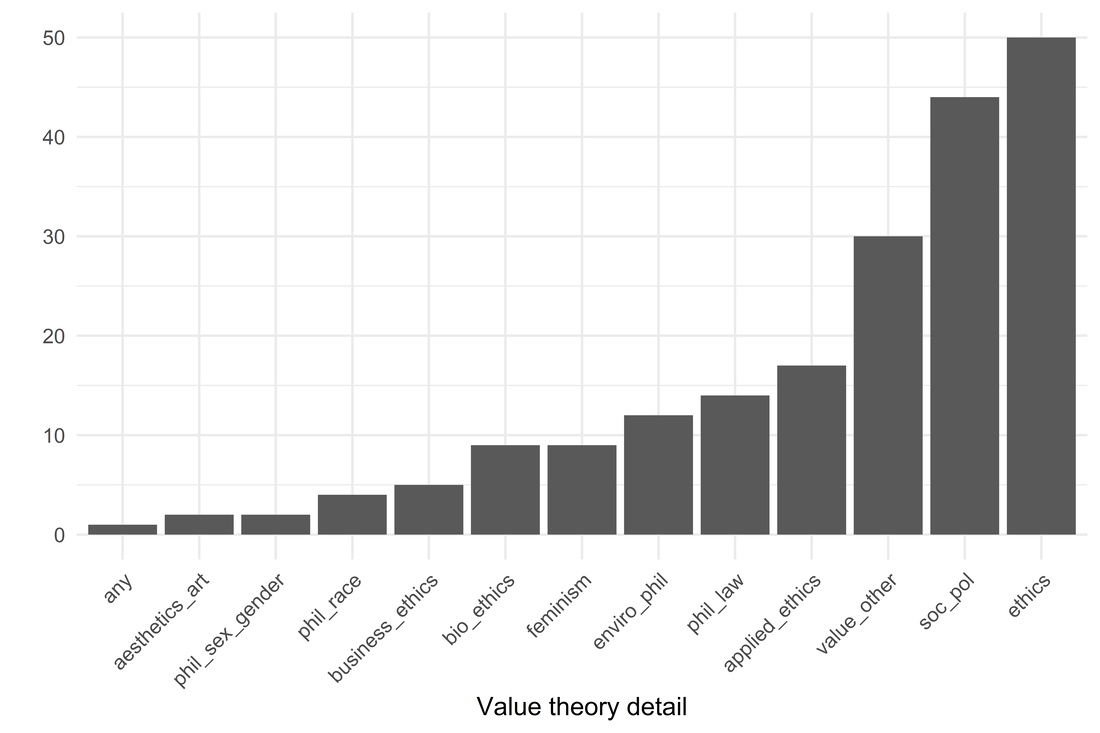
Ethics dominates, followed by social and political philosophy. We'll get to "other" in a moment. Sadly, phil of art is at the bottom with two ads.
Value_other is a catch-all for specific areas that don't fit neatly into any of the other categories. It was a hodgepodge of seemingly grant-specific areas, e.g. citizenship, media ethics, etc. But there were 3 ads for AI ethics and 2 for ethics and tech. So there are more job ads for ethics and tech/AI than there are for phil of art or phil of sex and gender. Let's take a closer look at history and traditions to see what's up there: 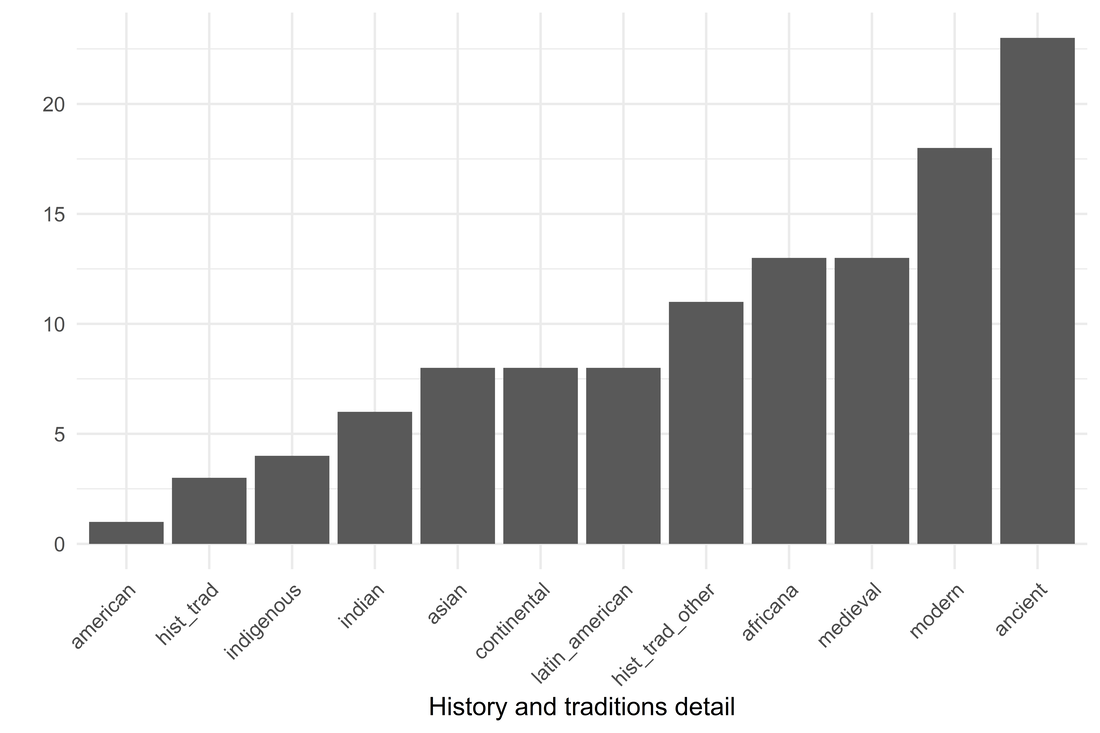
Carving up this data was a bit trickier. Some ads just had "history of philosophy" without any detail. Others said "non-Western". For the former, I listed ancient, medieval, and modern as covering a generic "history of philosophy." And for non-Western, I listed Asian, Africana, Indigenous, Indian, and Latin American as proxies. So again, keep in mind that these aren't total job counts but rather (roughly) jobs for which one could apply if one were an expert in (say) ancient or Latin American phil. Given these assumptions, ancient is in greatest demand.
Non-western traditions are on the map, but not in huge demand. "Africana" showed up in 13 ads while "indigenous" showed up in four. Though it's worth noting that Africana is in higher demand than a number of subcategories in value theory. Now science, logic, and math: 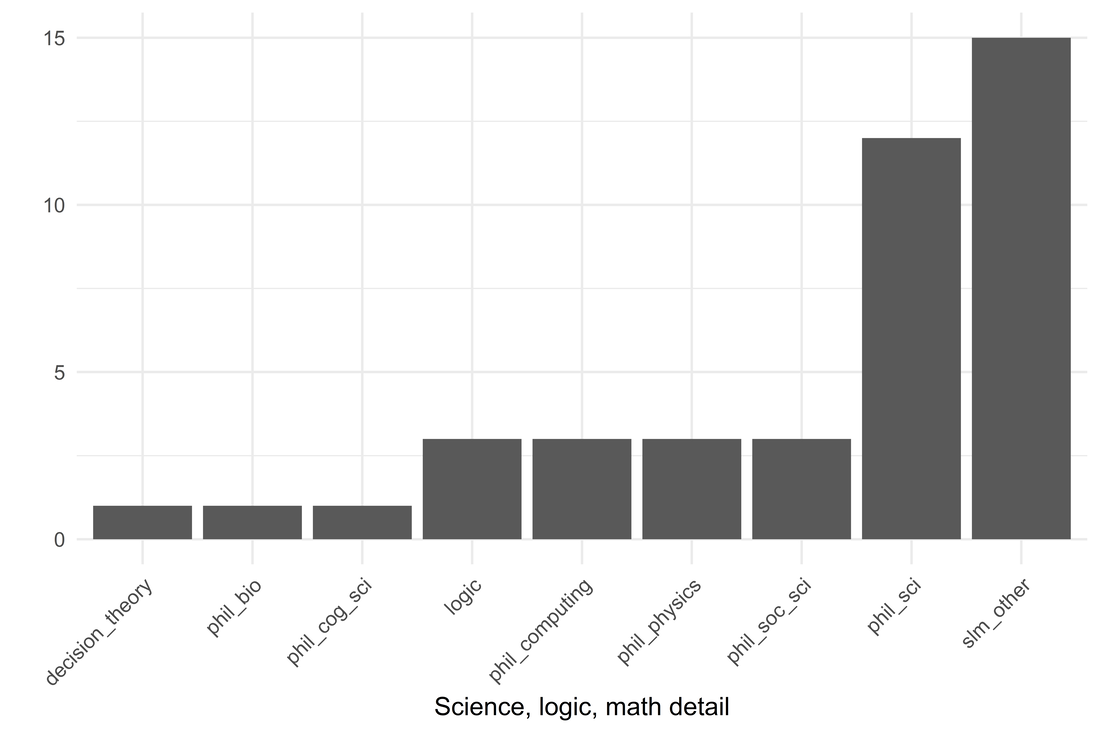
Philosophy of science is leading the way with relatively few opportunities for other subfields. What's up with the other category? This is a grab bag of: history of science or medicine or technology; AI; the metaphysics of science; postdoc ads that are too specific to classified anywhere else (e.g. a project on episodic memory)
The last category: metaphysics and epistemology.
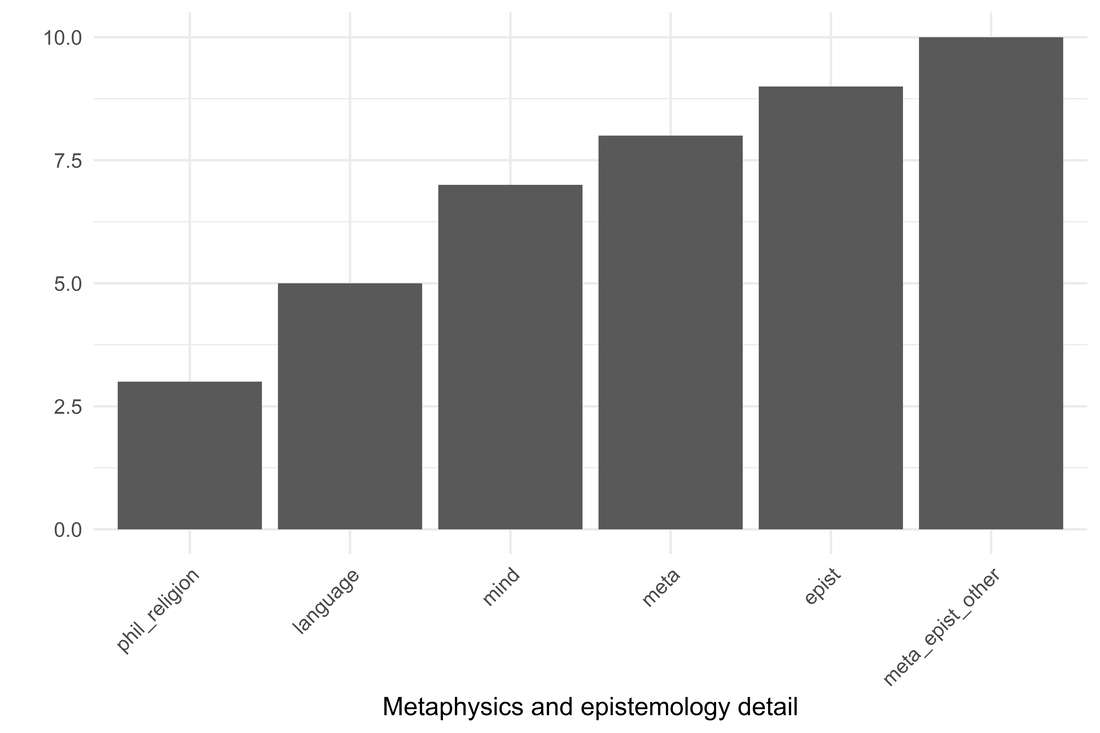
Seven jobs for philosophers of mind? Nine for epistemologists? Yeesh. what's in the "other" category? Five philosophy of technology positions, a social epistemology, and a couple of animal cognition.
What's interesting about this from my view is when there are repeated instances in the "other" category. This suggests the emergence of an important subfield that isn't yet counted among the standard options, or at least not in any obvious way. Decision theory has a subcategory on Philjobs, but philosophy of technology doesn't. Nor does history of science/STS, even though phil tech and history of science each had more ads than decision theory. I'd say that history of science/STS and phil tech are established subfields. A colleague of mine who works in phil tech once described it as fringe. Kirby, if you're reading this, I don't think it's fringe any more.
Let's now filter AOS by junior positions and post-docs. Here's what that looks like:
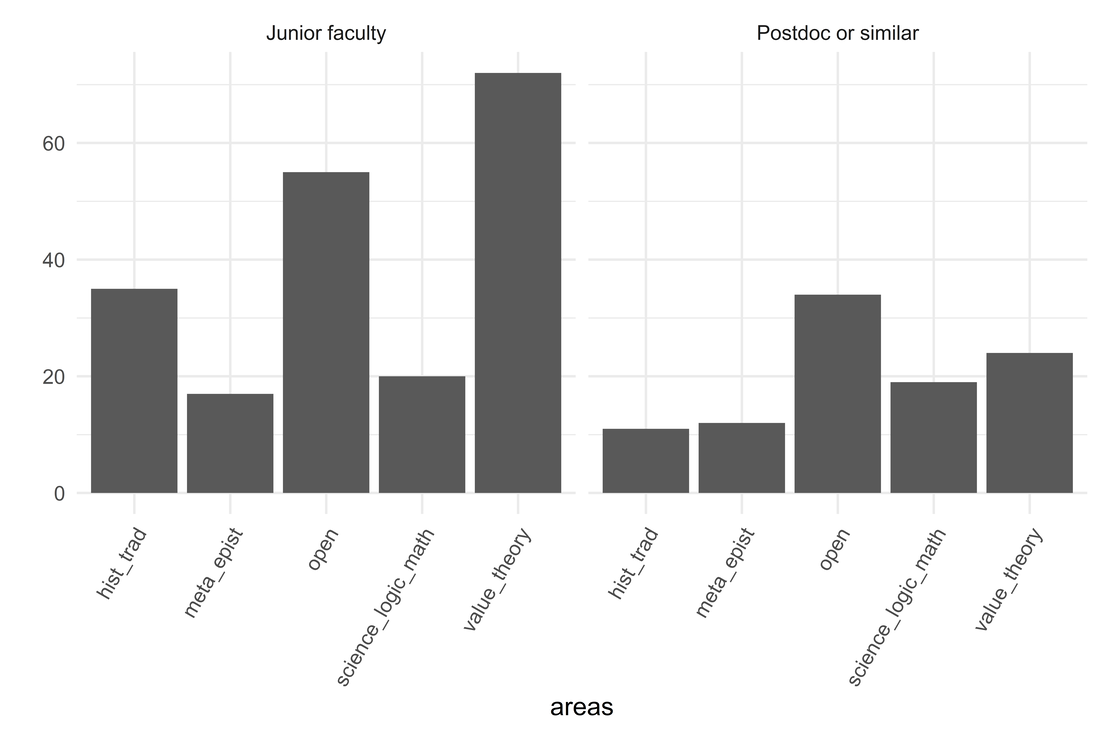
So trends for junior positions largely follow that of all positions. Most are in value theory, followed by open and history/traditions. Things are a bit different for postdocs, with the greatest number of positions being advertised as open. In talking with my friend Nader Shoaibi, I wonder if digging into the details makes the picture a bit drearier than the numbers here say. I'll use myself as a test case. If I were going on the market, I'd apply for open jobs and jobs in philosophy of mind. I'd apply for everything but would really be looking at tenure-track jobs--that's where the security is at. Filtering for those values, there are 36 jobs: 33 open and 3 in philosophy of mind. I got my PhD at Fordham, so let's be realistic about my job prospects. I know, I know...that one person went from Oklahoma to Harvard (apologies I can't remember their name). Fantastic for them but clearly an outlier. At a non-prestigious university, I can cut the Ivies and lots of R1s from the list. And let's take jobs outside the US off the table because I'm not a superstar and a university outside the US is unlikely to pay for the costs of hiring a foreigner. That leaves me with 16 openings, all advertised as open. That's all to say that the numbers don't look great in the big picture and things only go downhill when getting into the weeds. I'm hoping to get some help soon for looking at AOS trends since 2015. It's a lot of data to clean. But I'll be sure to let you know when that's available. As always, if there are any other analyses you're interested in, please let me know! Hey friends. I've been busy with new semi-admin duties so I haven't been able to do as much blogging as I like. So it goes. So we're going to take a look here at the primary cycle (July 1 - December 30). This is when most job posting happens. Here's a look at postings across all job types. 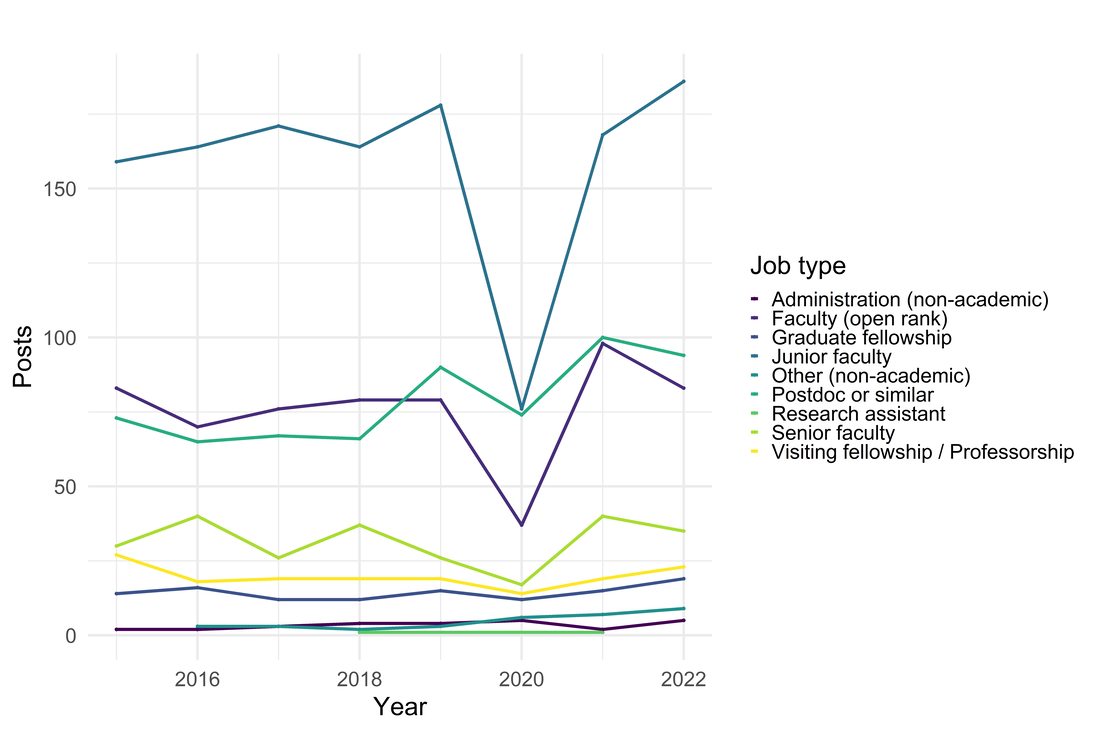 Remember 2020? Oof da that was a rough year. Anyway, we're trending a bit higher than usual on junior posts relative to previous years. In fact, the trend for junior posts over the last seven years has been more jobs. Open rank, postdoc, and senior posts are down slightly but still within a normalish range historically. Visiting fellowships are up slightly, but still within a normal range. In case you want the numbers for junior, postdoc, open rank, and non-academic, here are those: 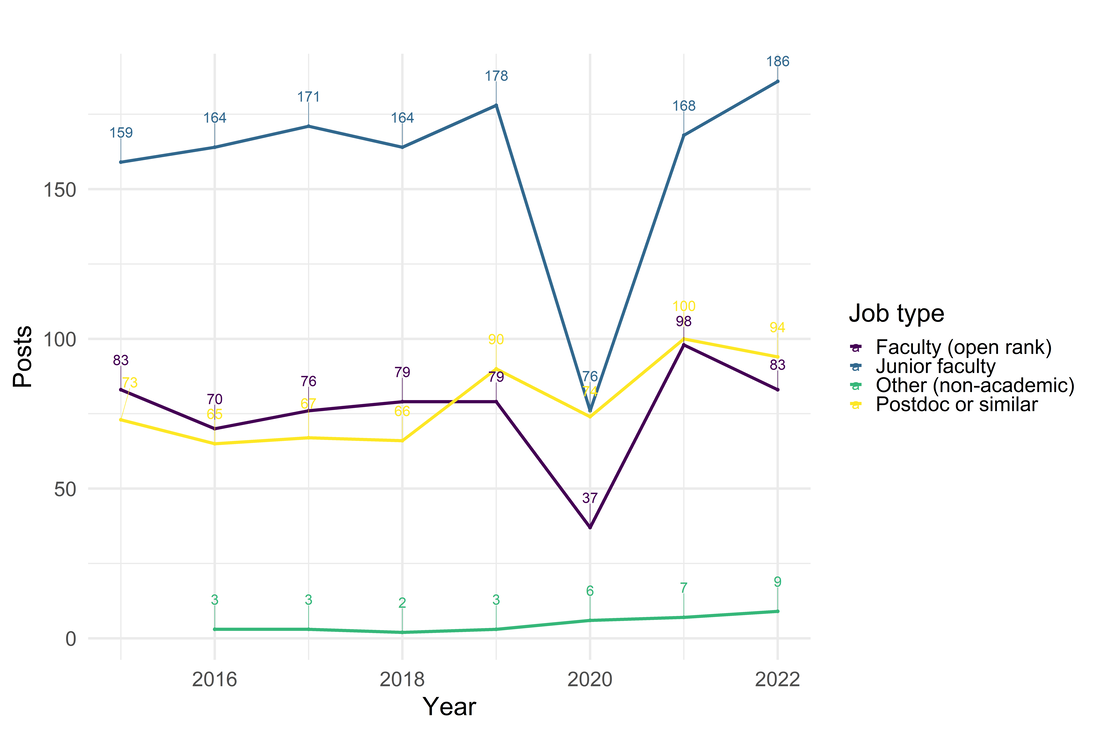 Let's zoom in on junior positions. 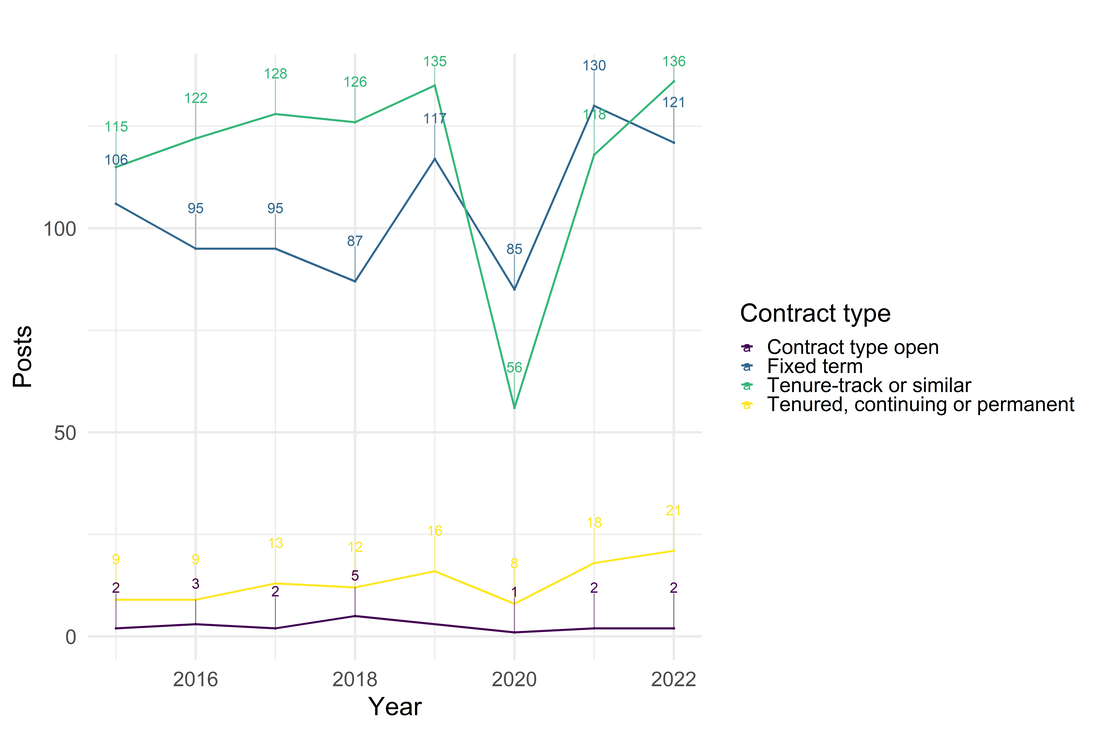 This one is tricky to interpret. Trend lines (not included) suggest that the TT market has been trending downward over last 7 years, but that includes 2020, which is an outlier. Excluding 2020, we find that the market is trending towards having more jobs. Even so, it's not a huge trend. The NSF's Survey of Earned Doctorates reports that there were 399 new PhD's in philosophy in 2021. So even though it's an upwards trend, it's not moving fast enough to accommodate all the new PhD's.
So there you have it. The job market isn't looking all that different from pre-2020 levels. Some slight increases but none significant enough to breathe a sigh of relief heading into the market. I've said it before and I'll say it again: the APA and grad programs need to put more time and energy into non-academic career paths. One of the more challenging questions to figure out is how many people are applying for academic jobs. The NSF's Survey of Earned Doctorates puts the number of new philosophy PhD's per year at ~450. But people are on the market multiple times and not everyone who gets a PhD applies for academic jobs. So how many people are applying for jobs? I sent out a survey to heads of search committees to begin figuring it out. But first: gratitude. Nathan Ballantyne, Julianne Chung, Maria Howard, Greta Turnbull, Joe Vukov, Tim Weidel, and Shane Wilkins provided feedback on the survey and gave suggestions for thinking about the data. Our department's work study Kate Kellen collected emails from PhilJobs -- thank you Kate! She's graduating this year; so if you have a side gig and you need someone for data entry and similar tasks, drop Kate a line. I sent out around 200 emails and 70 surveys were completed. Thank you to everyone for filling out the survey. I originally was going to hold off until February because there are still some deadlines that haven't passed, but I'll update these numbers as more data roll in. The survey was brief: how many applicants, AOS (using PhilJobs' categories), job expectations, rank, and reaction to number of people who applied. Here's what I found: 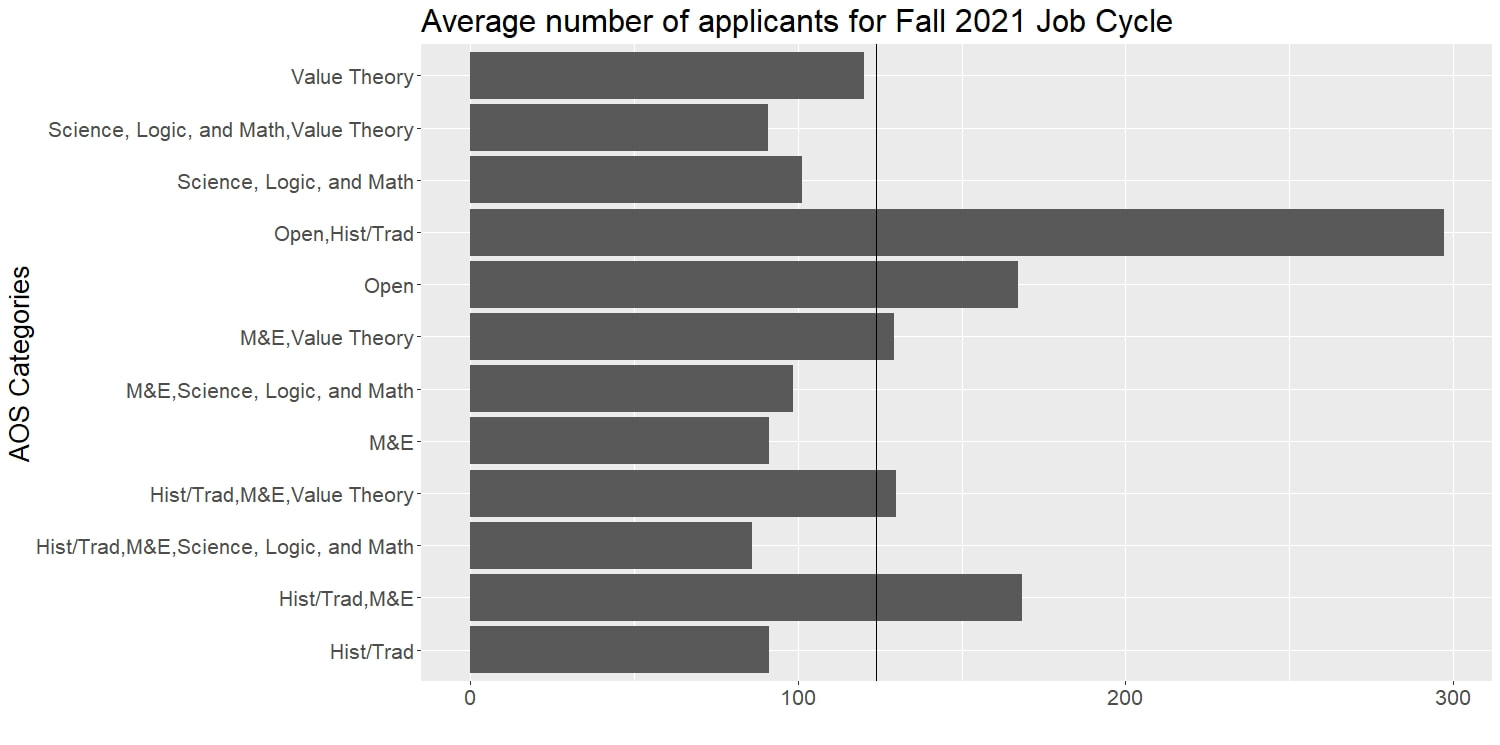 Because respondents were able to choose more than one AOS, we have a variety of overlapping categories. The vertical line is the average number of applicants across all categories, which is 124. (BTW carving the data this way, there wasn't a big difference between mean and median.) What are the upper and lower bounds? The point is the average for each AOS grouping. 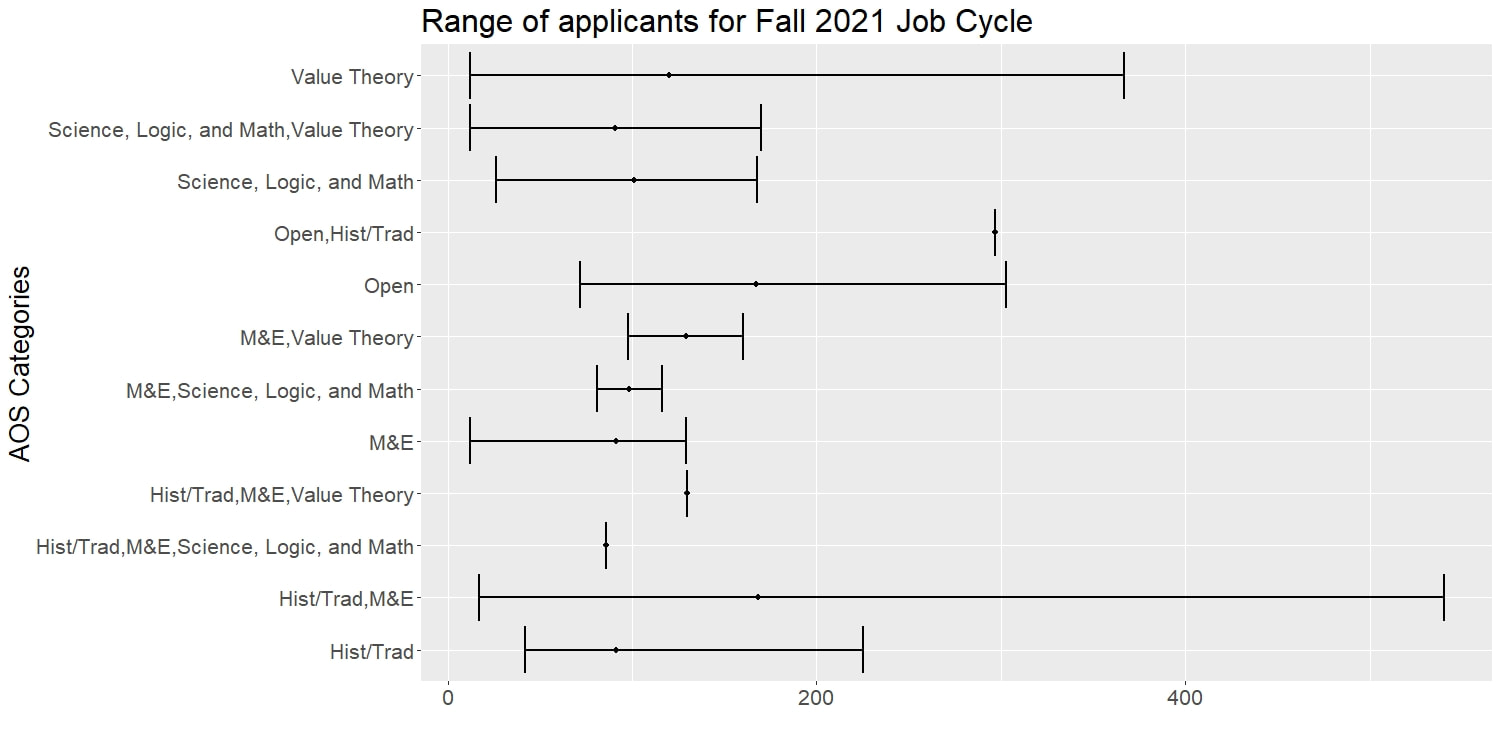 Now let's do it for rank. Since there were some sizable differences in some categories between the mean and median carving up the data this way, I've included both. Compare, for instance, open rank average and median. (This is explained by an outlier of 524 applications!) Now let's look at ranges by rank. The point is the median because outliers had a bigger effect in some categories carving the data this way. Here's a heatmap crossing AOS with Rank. The lighter the color, the greater the average number of applicants. No color means that there weren't any data for that combination (e.g. Postdoc and Hist/Trad). 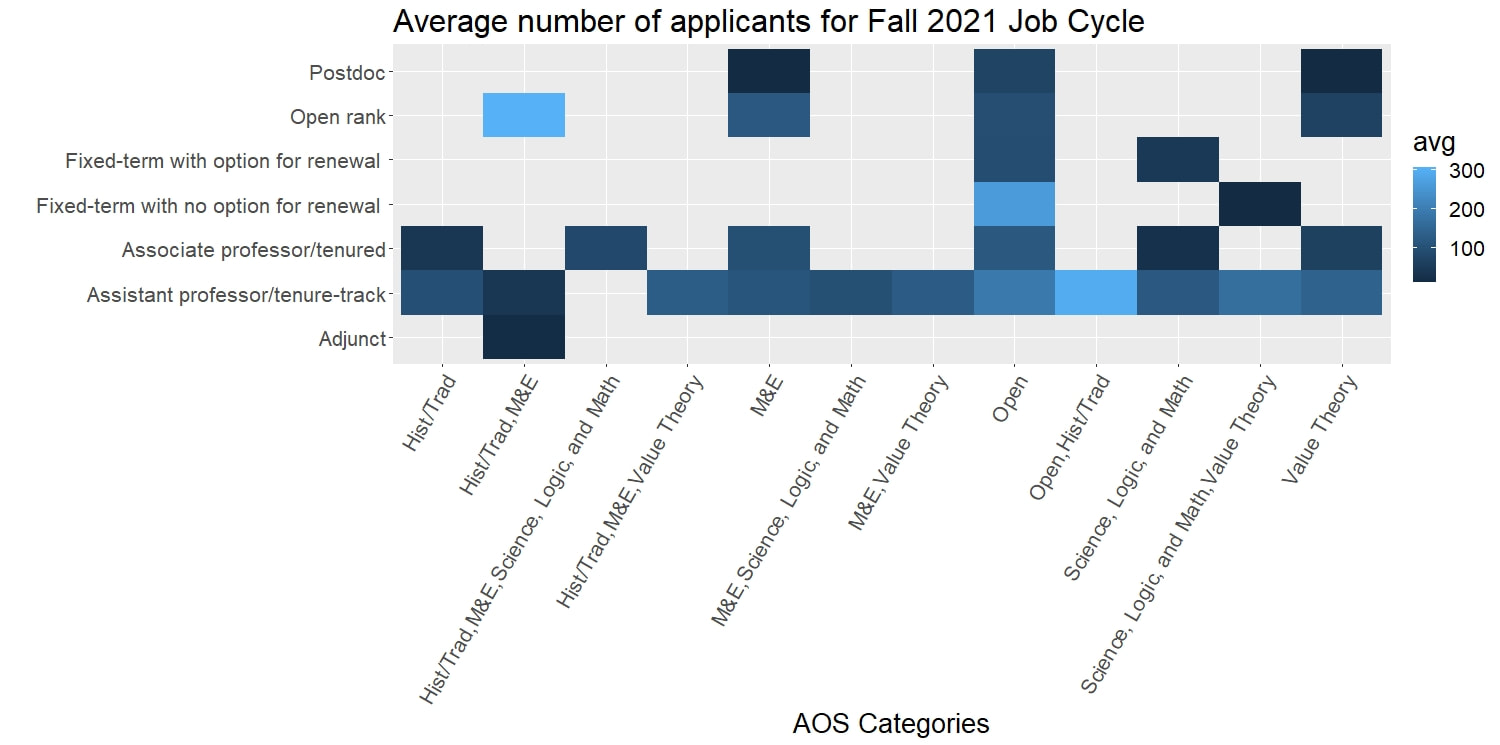 Finally, let's look at number of applicants by job expectations and rank 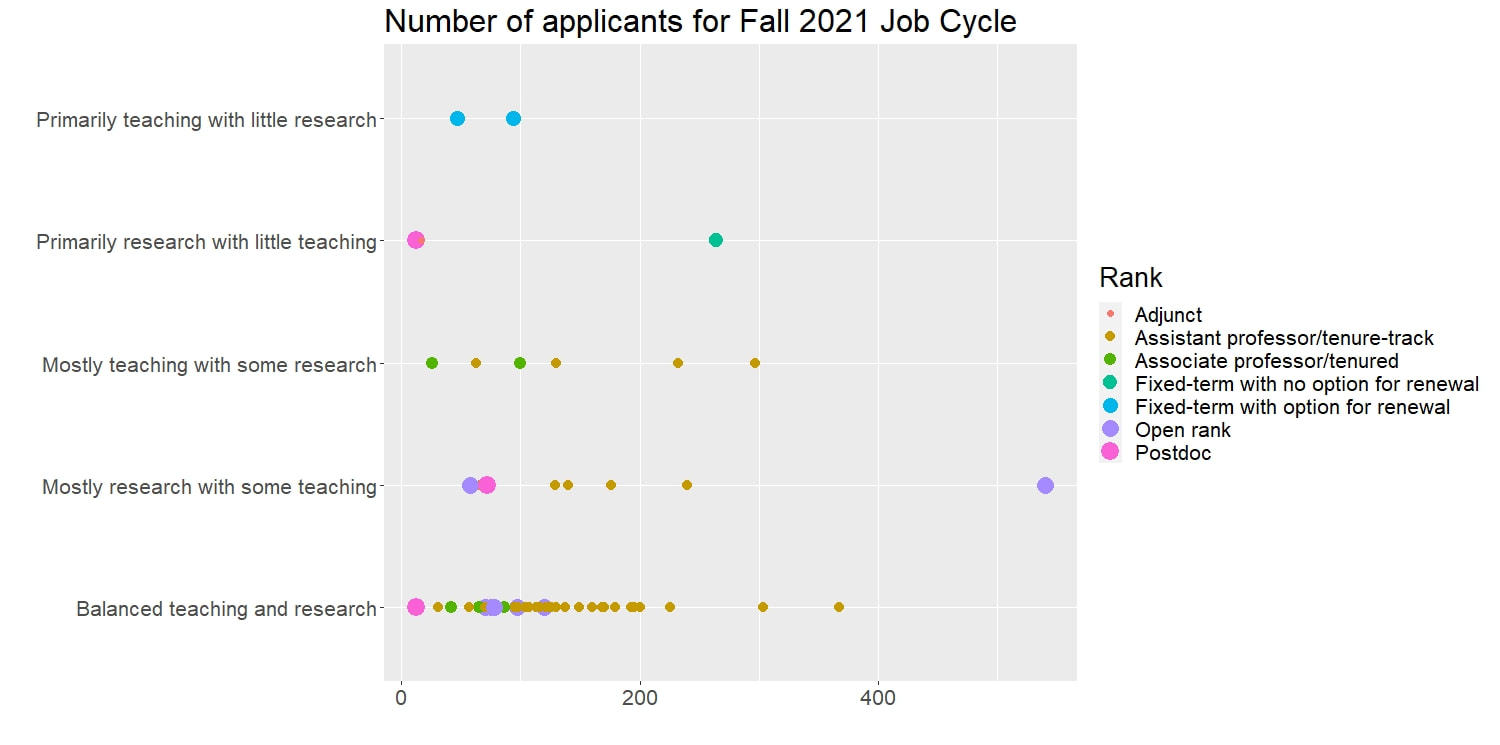 There are the data. What are the takeaways? First, I was expecting upwards of 300 applicants for open AOS, but it's about 175 (including open combined with other areas). If we filter for open AOS and TT, then the number of applicants goes up to 200. Second, it doesn't seem like applicants discriminate much between TT and fixed-term jobs: there are about as many applications for TT jobs as fixed-term without renewal jobs. This makes sense: philosophers gotta pay the rent, if only for a year. Finally, it looks like a job with balanced teaching and research demands had more applicants than straight research gigs. This is fascinating. It seems like, contra received wisdom, people aren't holding out for cushy research gigs. If we're judging by numbers of applicants, having a mostly research job isn't the ideal for many young philosophers, contra the received wisdom. The question to my mind is, why are there so few applicants? Don't get me wrong -- 200 on average is a lot of people. But I expected there to be much more given the awful market last year. Consider the following graph of junior job ads: 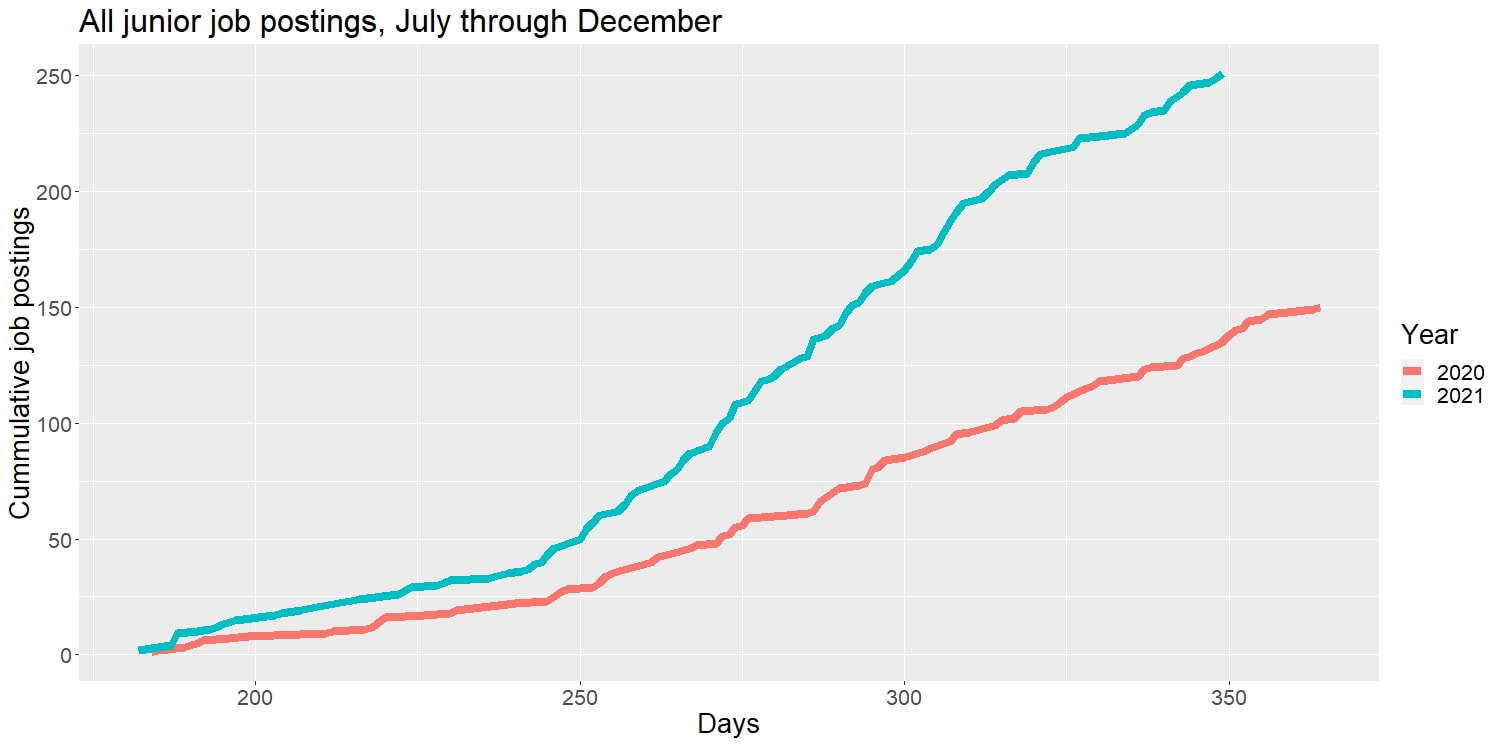 There were nearly 250 junior job ads posted this cycle. (I added 2020 to remind us of how many fewer jobs were advertised last year.) The highest value for an open AOS TT position was 303 and for value theory it was 367. So obviously there are more applicants than there are jobs. The discrepancy here is interesting: there are some folks who applied for value theory TT jobs who didn't apply for open AOS jobs. So using open AOS as a proxy for number of people on the market comes with some caveats.
It looks like people are being selective in which jobs they apply for, which of course makes sense. I guess I didn't imagine how selective people were being. The only job I passed on when I was on the market was one in Kazakhstan, and that was at the request of my spouse. But maybe that's just my desperation. Also, there might be a selection bias in the responses. I sent out emails to the names listed on job ads whose deadlines for applying had passed by Dec 1. Maybe positions with higher numbers of applicants didn't complete the survey. I'm interested in hearing from people who passed on applying this year or didn't apply for some jobs rather than others. If you have a moment, please post (named or anonymously) in the comments. That's all. If you can think of other analyses you'd like to see, please contact me at [email protected] . Thanks for reading! My colleague Nader Shoaibi suggested that there have been fewer "open" AOS ads than in previous years. Is that right? First a plea: if you're going to post a job, please use a heading like "epistemology" or "metaphysics" or "ethics" and then go into detail in your ad. The detailed description in the AOS section makes it really hard to look at larger patterns because there's so much cleaning of the data to do. I mean really, University of Leeds, you wanna through this at me: "aos is in principle open, but a background in areas of philosophy related to counterfactual thinking is required." For a postdoc ad?!? If it's open, then it's open. Otherwise, say you're looking for whatever it is you're looking for. Anywho, here are the numbers on "open" ads compared with a few other hits. 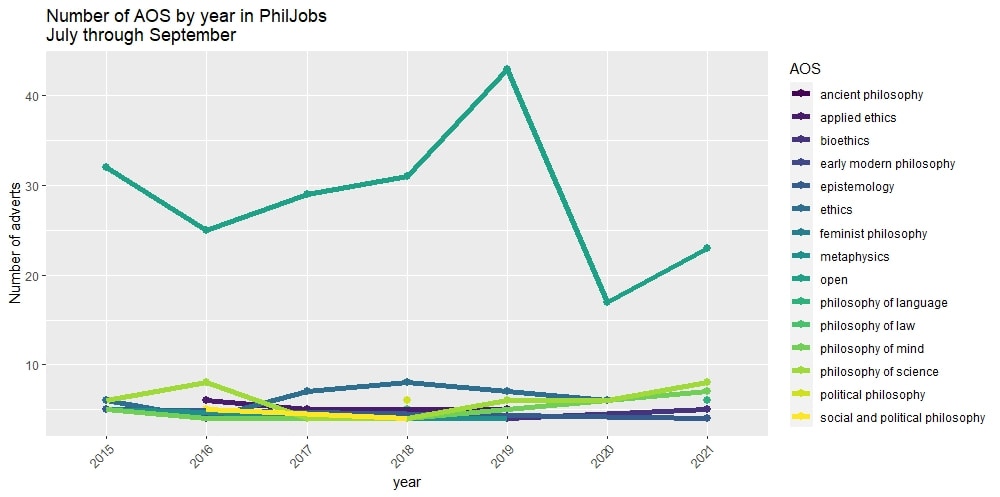 Looks like Nader was right, there are fewer "open" ads than in previous years (with the exception of 2020, of course), though not too far off from 2016. A few quick caveats:
1. This is for July to September for each year. I'll try for an update when October is through. 2. I'm doing this in between grading papers for midterms, so the cleaning of the data was fast. I'm confident in the "open" line, but not the others. Why? Because so many ads have detailed descriptions. I've added the others for fast and semi-reliable comparison. |
About me
I do mind and epistemology and have an irrational interest in data analysis and agent-based modeling. Old
|
 RSS Feed
