Soaked Feet,
Bone-dry cuffs

|
IT'S AS GOOD NOW AS IT WAS IN 2016! In the words of my boy Kai Ryssdal, let's do the numbers...*cue sad trumpets* (Kai, if you're reading this, can we be friends? You can reach me at [email protected]) 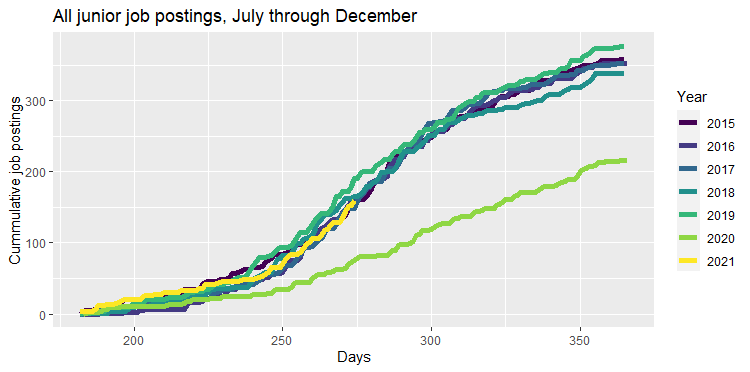 Quick word on reading the plots: the numbers on the x-axis are days since January 1 and plotting the numbers begins on July 1. All junior job postings for this year are tracking what things have been looking like since 2015, with the exception of 2020. We're not quite done with our peak season for job posting. That comes in December. (Then things are calmer from January to July, with a slight bump in April/May.) So if 2021 is trending like 2016, we can expect some more job postings before the holidays. But temper your expectations, job-seekers. The most popular deadline for getting apps in for TT jobs is November 1. Now let's break this out into postdoc and TT/Fixed positions. 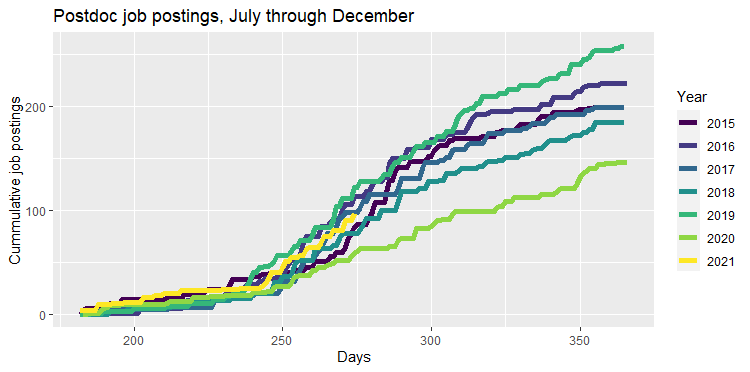 The bright yellow line that is 2021 is keeping pace with recent years, again with the exception of 2020 (though notice that by December, 2020 wasn't that far off from 2018 for postdoc positions). So that's unsurprising but good news. (Though with job market data, "good news" is always relative.) 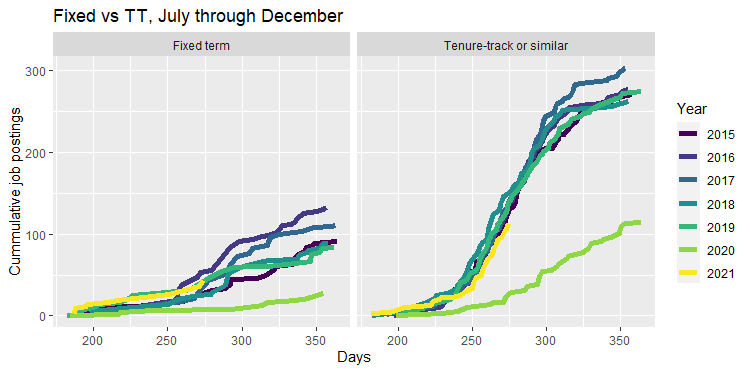 Again, it's looking like TT jobs this year are keeping pace with previous years (except 2020). Fixed term gigs have greater degrees of dispersion but it's looking like jobs this year are comparable to previous years. Here's a question: how many different institutions are hiring this year compared to previous years? Are there more places advertising for one or two jobs or fewer places advertising for 3 or 4? 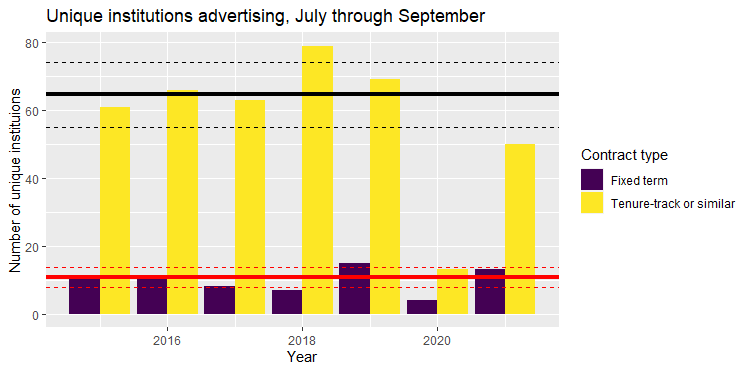 For TT jobs, it's looking like we're currently more than below one standard deviation for the average. (Note that the average and SD do not include 2020.) For fixed term, we're pretty darned close to average. (Solid lines are averages, black for TT, red for fixed term. Dashed lines are one SD away from the average.) So for TT jobs, the number of places that are hiring is lower than what we'd expect. Though nothing like 2020 *shudder* Oh, also note that this is for July to September. I'm counting only complete months and not month parts. Now, if we've ever spent more than 5 minutes together, you might know that I'm pretty consistent in looking for the dark clouds amidst the silver lining. "But how could things get worse?" you might ask. Take a look at the number of philosophy PhD's granted in 2020: 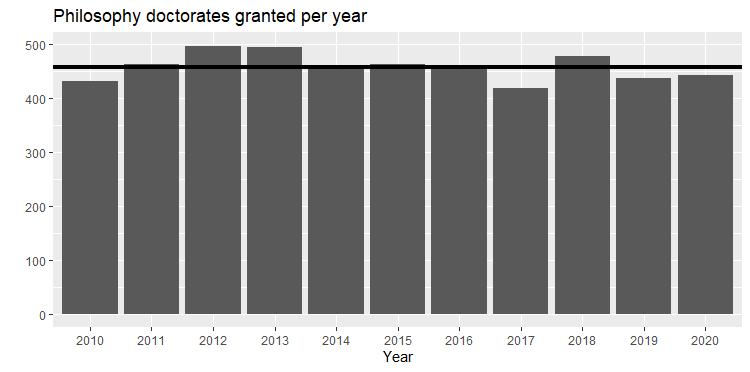 There wasn't a significant dip in the number of PhDs granted in 2020. In fact, it was fairly average. But with fewer academic jobs available in 2020 this means that either:
1. there's going to be a glut of applicants this year and probably for the foreseeable future. 2. more philosophers are going to be motivated to pursue work outside of academia. Of course, both might be true. But given that most PhD programs haven't prioritized non-academic careers, I'm guessing there will be a slight uptick in philosophers seeking jobs outside academia but a significant glut of philosophers looking for academic positions. Good luck and Godspeed, friends. Speaking of, calm your nerves with some Godspeed You! Black Emperor. Maybe "The Dead Flag Blues" to chase away your blues? A friend on the Facebook prompted to me to think about "expiration dates" on PhD's. It's common to hear that a PhD can go stale, i.e. after a certain number of years a candidate is no longer as appealing as they once were to prospective employers. But what are some of the numbers? The PhilJobs appointment dataset has both (i) the year of hiring and (ii) the year the appointee earned their PhD. We can use that to start getting some clarity on when staleness sets in. Using the data I downloaded from PhilJobs at the end of April, here's a set of counts: 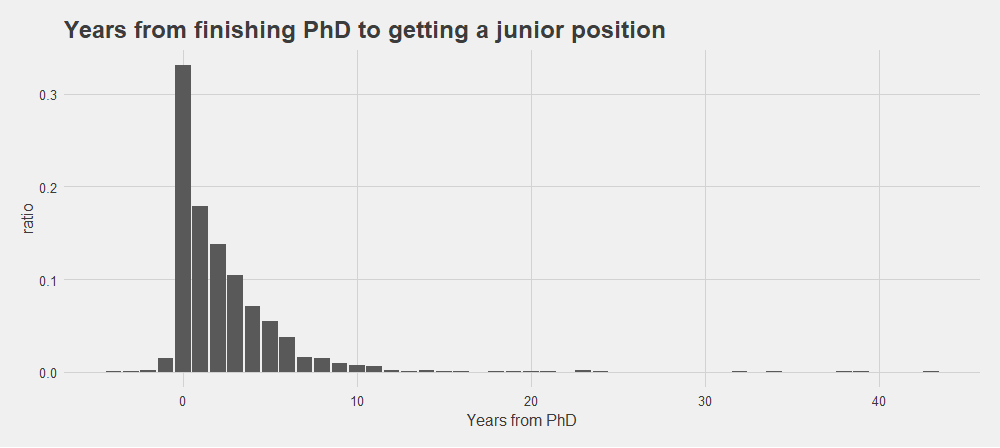 1/3 of junior placements posted to PhilJobs get a job the same year they finish their PhD. And, as you can see, things drop off quickly after that. Less than 1% of posters list a job after 8 years post-PhD. There are two hypotheses possible here, which are not mutually exclusive: (1) very few people get a job after 8 years post-PhD (2) some people change jobs and don't post their new jobs (3) as people get further out from their PhD, they are less likely to post a job EDIT 9:43 am PDT: (4) X people drop out of the market after N years (thanks to Marcus Arvan for this suggestion) If I had to put money on it, I'd bet (1) does more explaining of the phenomenon than (2) or (3). In the case of (2), it's difficult to reliably track individuals across positions in PhilJobs, so it's hard to be certain. I'm not sure how we'd rule out (3). I'd love to hear readers' thoughts, though. Here's a thought about (4). We have two explanations for the drop off: PhD's get stale or people drop out of the market. Clearly, these aren't independent of one another: stale PhD's are more likely to drop out of the market and folks who drop out of the market thereby have stale PhD's. My hunch is that these hypotheses would be really hard to tease apart. What would we need? One step towards answering it would be the number of people applying for jobs 1 year out, 2 years out, etc. We want to know (e.g.) the number of 8-years-out job posters out of the number of 8-years-out applicants. Here's another informative plot: the differences between successive years in job postings. That is, the drop in ratio of postings from 0 years from PhD to 1 year from PhD, from 1 year from PhD to 2 years from PhD, etc. (If you were to measure the gaps between the tops of the bars in the previous plot, you'd get this one.) 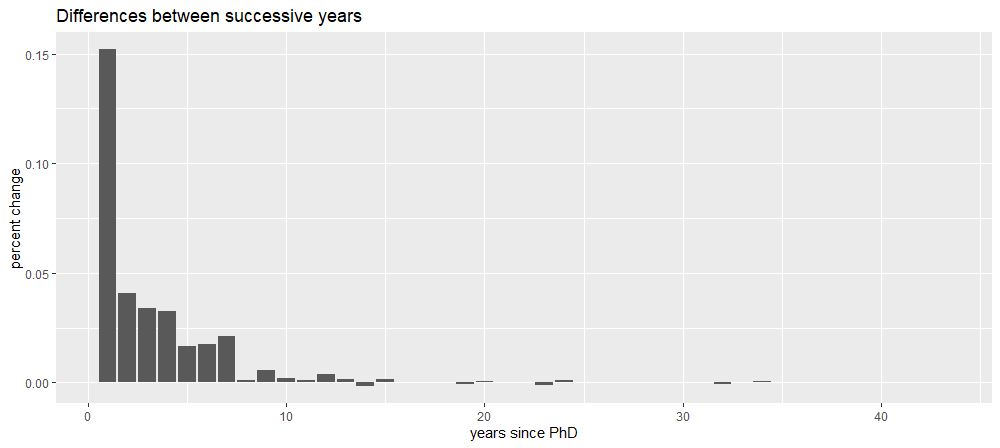 What does this tell us? Between 0 years from PhD and 1 year from PhD, there's a 16% drop in postings. That's to say, one year seems to matter a lot. From years 1-2, 2-3, and 3-4, things level off. There's not a big change in differences there. I think the way to interpret this is that there's not a big difference in ratios of job postings if you're between 1 and 4 years out from the PhD. 4-7 years out from the PhD is another drop. After that, it doesn't seem to much matter whether you're 8 or 28 years out from the PhD.
So there you have it. I think this gives us some idea of what it means to say a PhD is stale. The takeaways are: 1. there are levels of staleness: 8+ years is the most stale, 4-7 years is 2nd most stale, 1-3 years is the least stale, 0 years is baby fresh. 2. decay in job placements is exponential. The costs of not placing are greatest earliest on. After a while, the costs level out, but that's largely because jobs aren't being won. Thanks for Greta Turnbull, Tim Weidel, and Maria Howard for making sure I didn't ramble incoherently. After Justin at Daily Nous kindly shared this blog post, he received a number of replies on the social media that folks weren't posting their placements on PhilJobs. He asked if I could rerun the numbers after the post, which I was happy to do. Here are the new numbers: 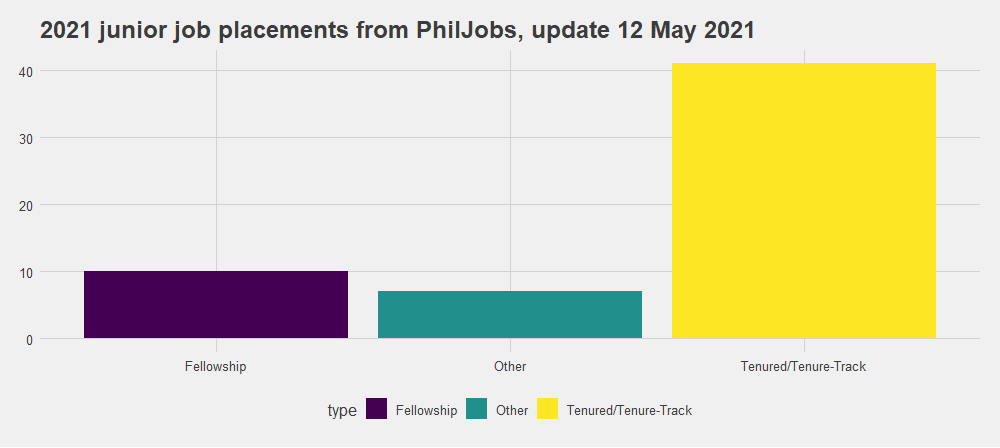 I was really hoping for a dramatic change, but the number of TT placements went up to 41 (from 30) and fellowships up to 10 (from 7). I suppose a 33% increase is pretty substantial, but when compared to historical trends of posting... 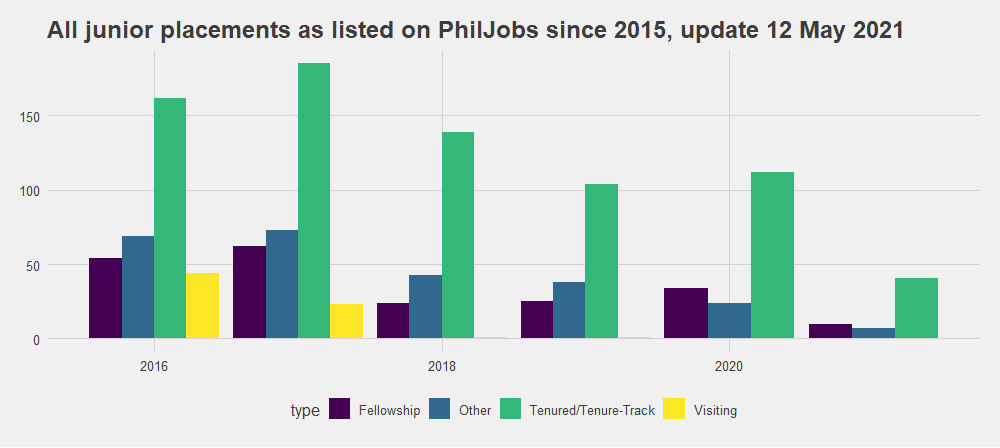 ...it's still not awesome. Some folks argue that not everyone posts their placements on PhilJobs or has a profile on PhilPeople; therefore, we can't put a lot of stock in these numbers. In reply, the way in which we interpret the numbers needs a little nuance. Did only 41 people get TT jobs this year? Maybe. Carolyn Dicey Jennings and her team might be able to answer that in a year or so. It's possible that there are a bunch of job searches that didn't work out. But what the data do tell is a broader trend about jobs in philosophy. The number of people getting jobs, I think, is declining. What I can't square with this is the number of job postings: 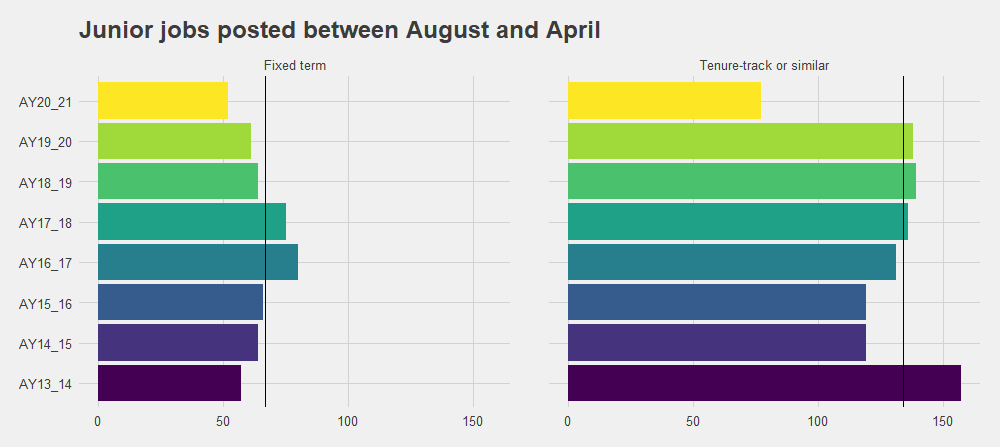 The vertical line is the average for all years except the most recent one. Fixed term = 66.7; TT = 134.1. And the boundary of August to April is to make sure we're comparing apples to apples for when this is posted. This year we have a serious dip in TT jobs. But notice the decline for the last 4-ish years in fixed term jobs. So my suspicion is that part of the fewer job placements is because of fewer fixed-term positions. It's hard to find long-term trends right now since Jobs for Philosophers officially moved over to PhilJobs in 2013.
Another hypothesis for why placement posting numbers are low: survivor's guilt. Folks who get jobs are less inclined to post about their placement because they don't see a reason for why they got the job and not one of their colleagues. The large number of people not getting jobs puts pressure on job-winners not to share that they've gotten a job. Anyway, thanks to Justin for the invitation to look at the numbers again. If you haven't posted your placement to PhilJobs, please consider doing so. The more up-to-date info we can get on the job market, the better off we'll all be. I initially said that I'd post updates about placements on PhilJobs every six months. When I committed to this in February, I didn't realize that I'd be up to my neck in work in March and April. I'm getting to it, but it'll take a minute! Anyway, something I do have done is the counts of job placement postings on PhilJobs. Let's look at 2021. 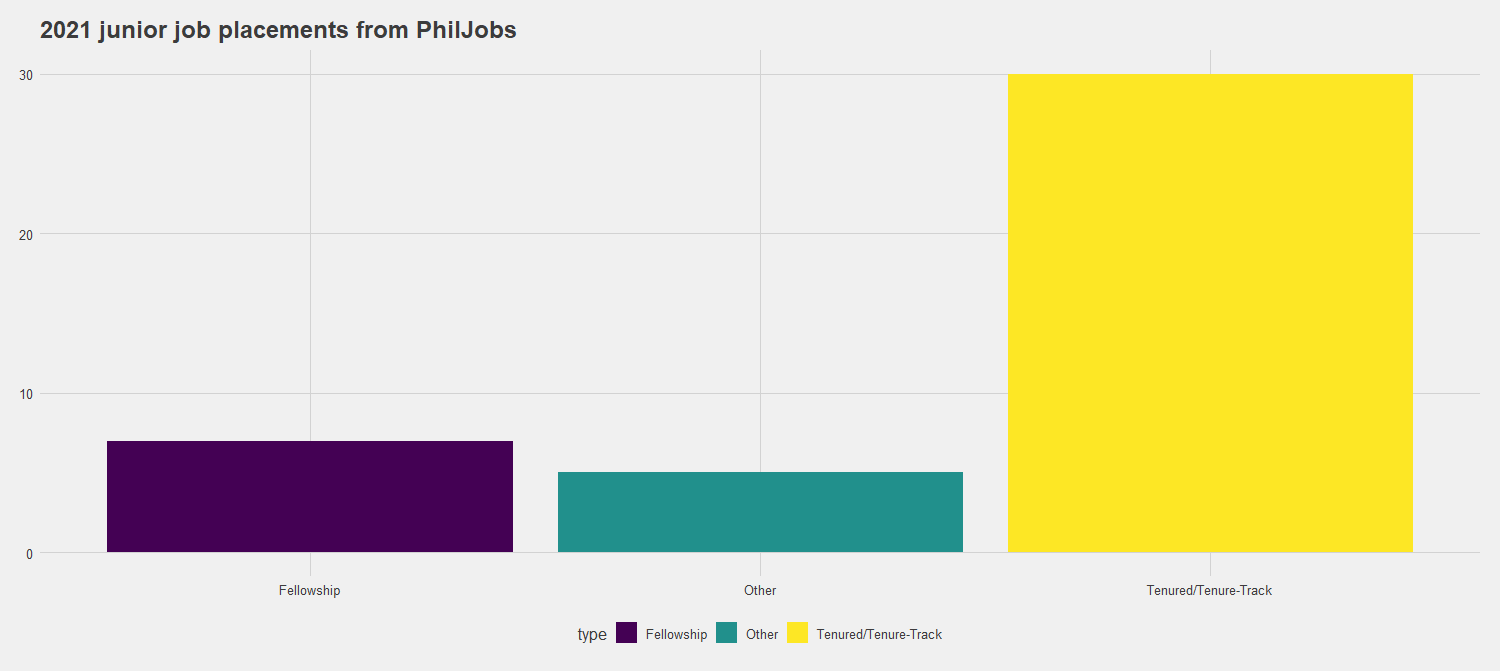 There were 30 TT, 7 fellowship, and 5 "other" placements listed. Now let's compare this with trends since 2015. 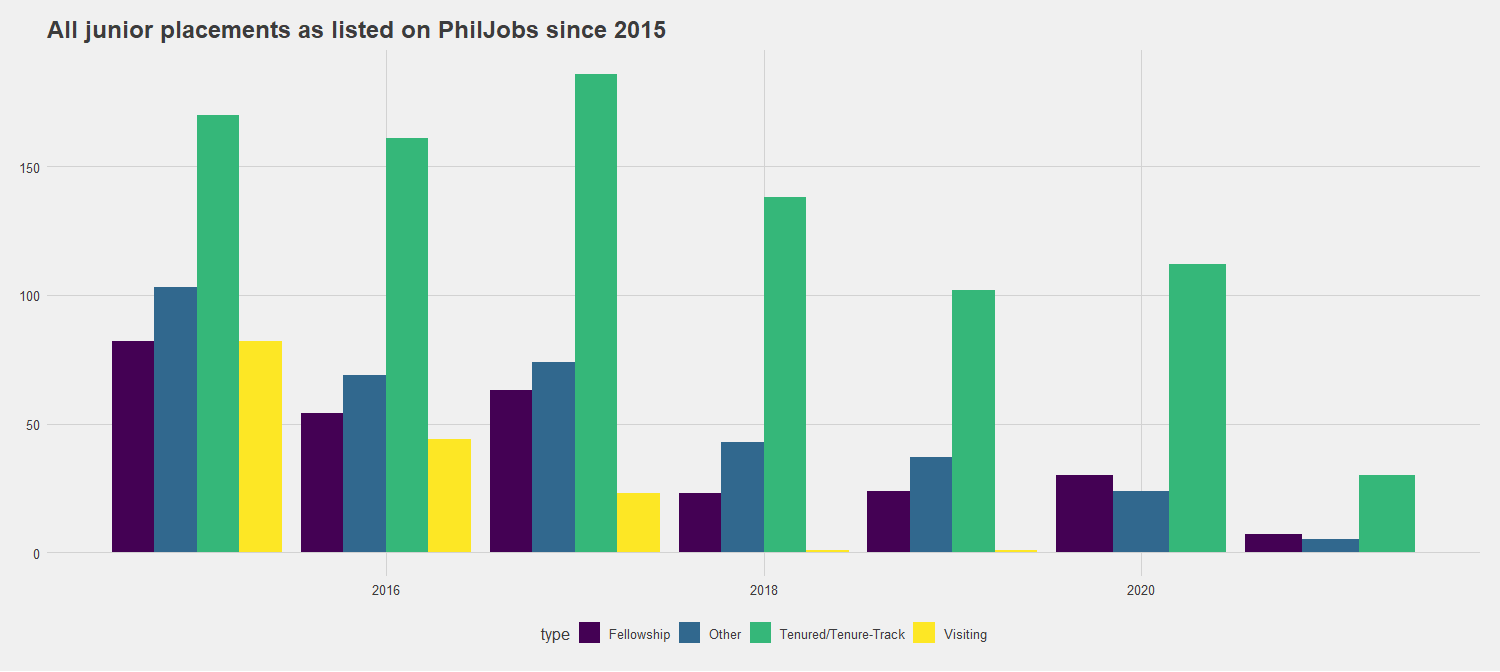 2021 is trending way below average. You might notice that there aren't any placements for visiting positions in 2020 or 2021, but we know that there were visiting positions advertised. What does this mean? We know that, as of November 2020, there were only 5 visiting positions advertised. We also know that PhilJobs is a source of information about the job market that is timely but gappy: not everyone posts their placements on PhilJobs or PhilPeople. Given that there were so few visiting positions advertised for this year, it's not surprising that there are no posts for VAP placements. The big takeaways: 1. placements are way down this year (unsurprising, I know) 2. VAP positions and placements took a big hit, which is unfortunate since these positions are one way in which newly-minted PhD's get their foot in the job market door 3. we're likely going to be looking at a big backlog of job seekers next year 3a. look at this three-year rolling average of junior job posts: 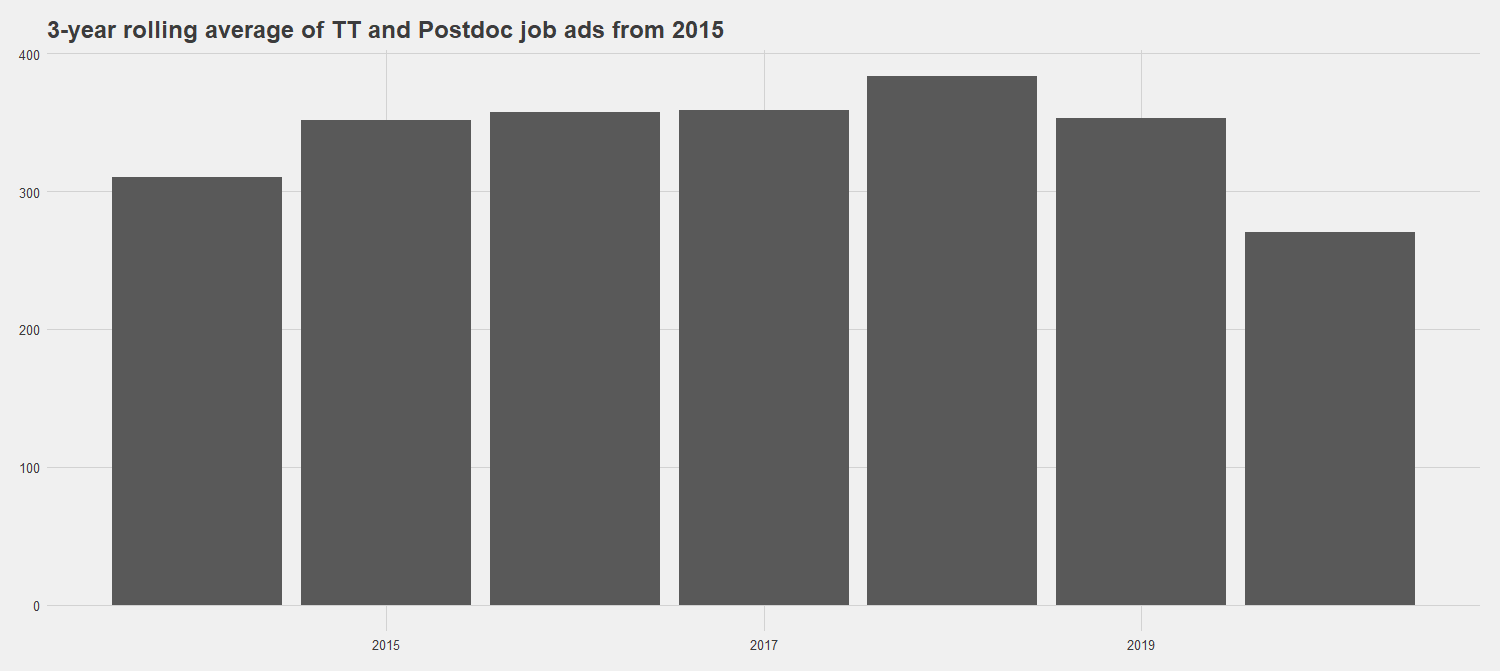 (Why a rolling average? Jobs are advertised in academic years, not calendar years. The rolling average is one way to smooth this out.) Jobs ads have dropped off recently. What are the chances they'll pick up to pre-2020 levels for the 2021-2022 job cycle? Given the closures of departments that have littered the news, I'm guessing fairly low. The usual glut of applicants for jobs is going to be even greater this time around, I would guess. How much more? That's hard to say. The Survey of Earned Doctorates I don't think has published their data on PhD's in philosophy earned in 2020-2021. Carolyn Dicey Jennings has the data here. It looks like there was a downtick in 2019, and I imagine the same for this year. But unless the downtick in PhD's awarded is accompanied by lower admissions to PhD programs and/or higher drop-out rates and/or fewer people attempting academic jobs, the backlog will bounce back some time.
Marcus Arvan on The Twitter expressed cautious optimism for next year. Marcus might have access to info that I don't; but given the tea leaves now, I doubt things will be much better for job-seekers.
Before we get to the numbers, perhaps you should soothe your soul with BB King.
Comparing cumulative job postings from August 1 to October 31 for the past three years, there are 53% fewer jobs posted on PhilJobs in 2020 compared to 2018 and 2019.
You read that right: there are fewer than half of jobs advertised this year compared to the last two years. Take a look at the graph below. 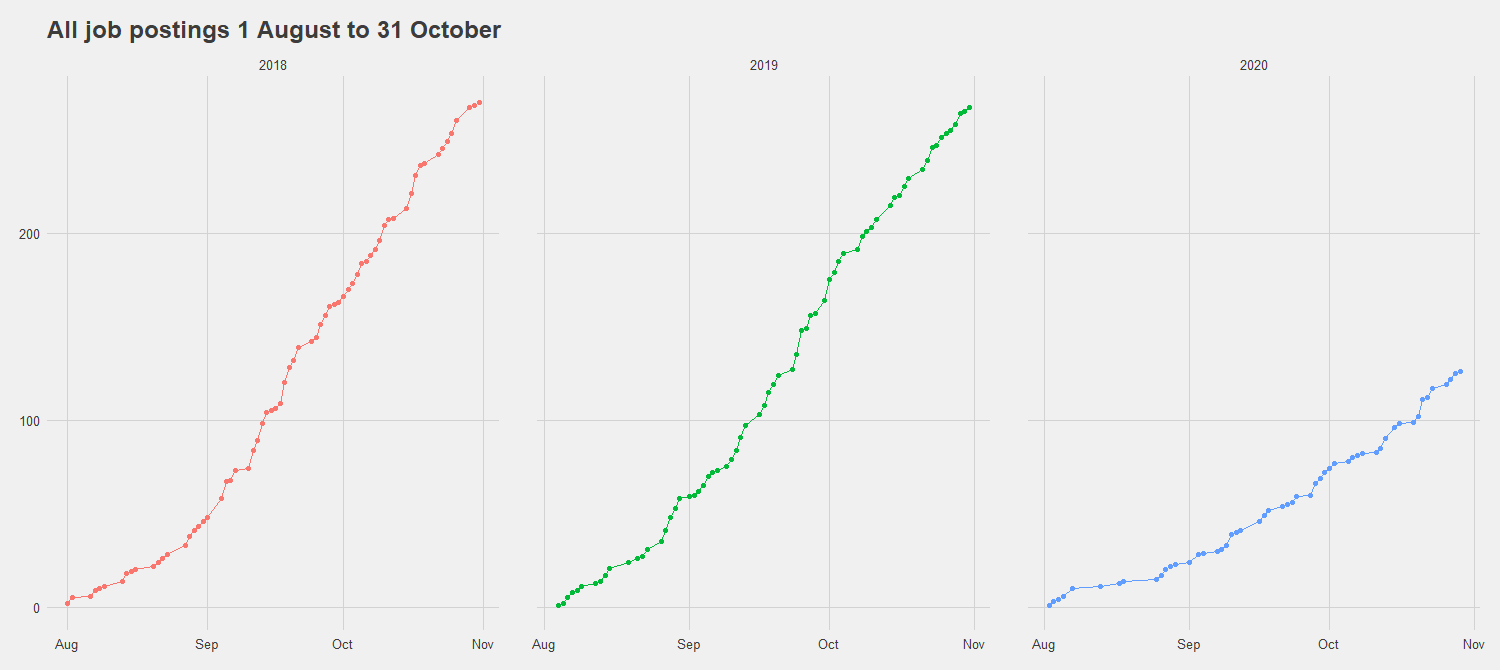
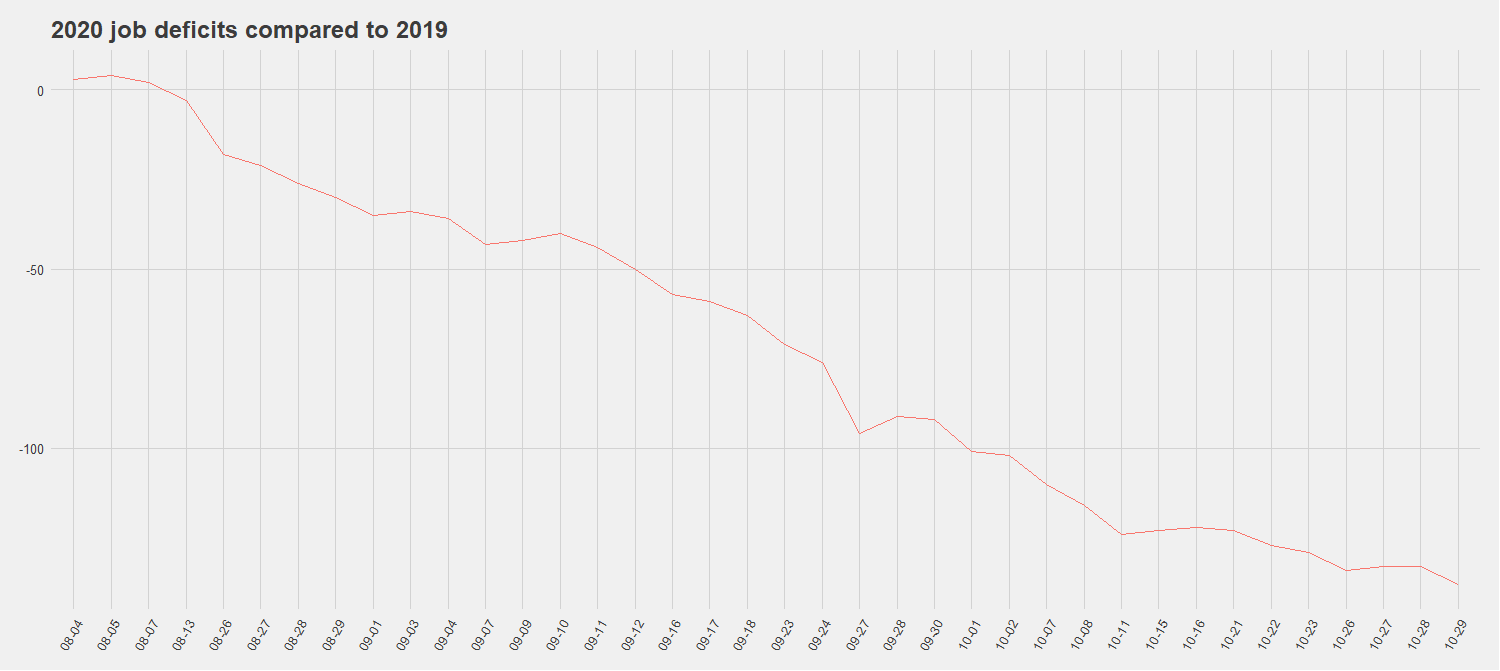
By the end of October in 2018 and 2019, there were 270 and 267 jobs posted (respectively). In 2020, there have been 126 jobs posted so far. If you're a real glutton for punishment, you can see the decline in job postings across three months:
Everyone suspected that the job market would be bad this year, but I didn't think it would be this bad, with fewer than half the number of jobs posted compared to this time last year.
Of the jobs that have been posted, what's the distribution of kinds of jobs looking like? Below is doing counts of job type (e.g. postdoc, senior faculty, etc) and contract types (e.g. fixed-term, tenure-track, etc) 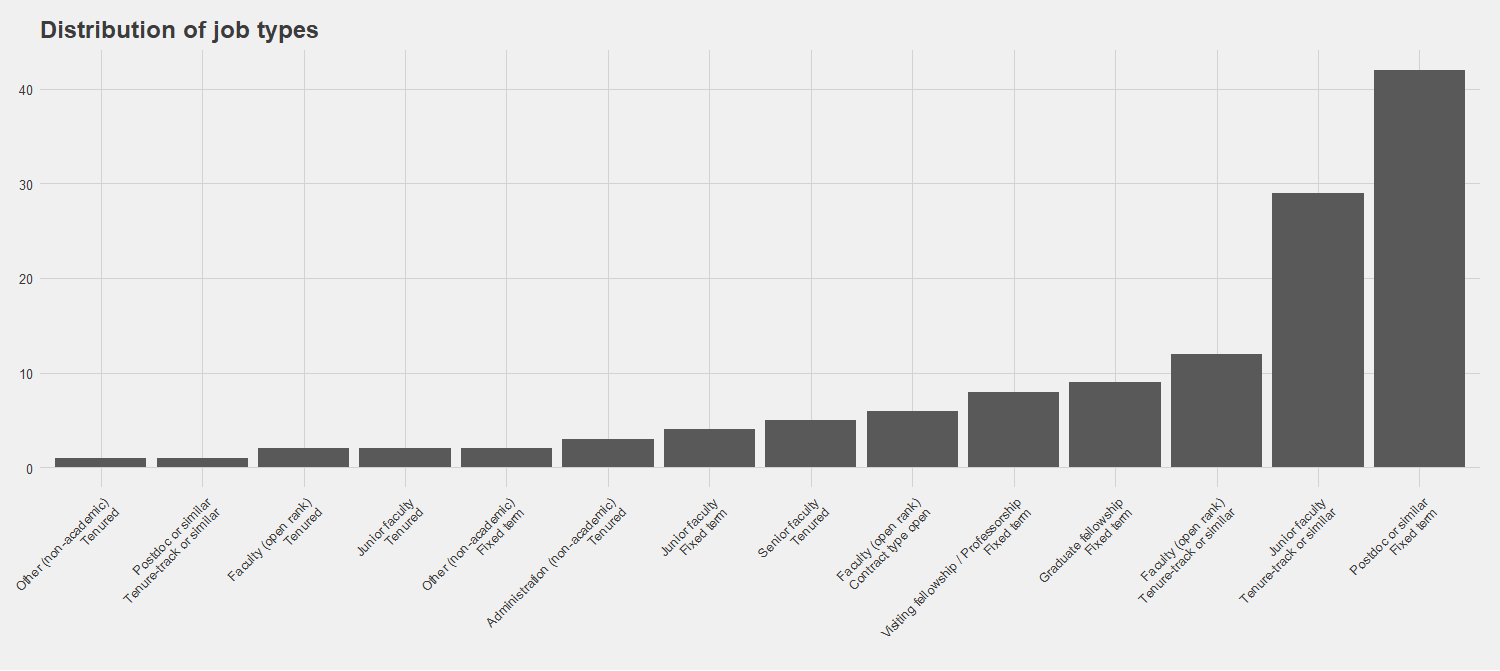
Most of the jobs advertised are postdocs or tenure-track positions. Unfortunately, most departments don't advertise adjunct positions on PhilJobs. I'd like to see if demand for adjuncts is increasing amidst all this.
Now, let's look just as tenure-track positions. How many have been posted now compared to this time last year? 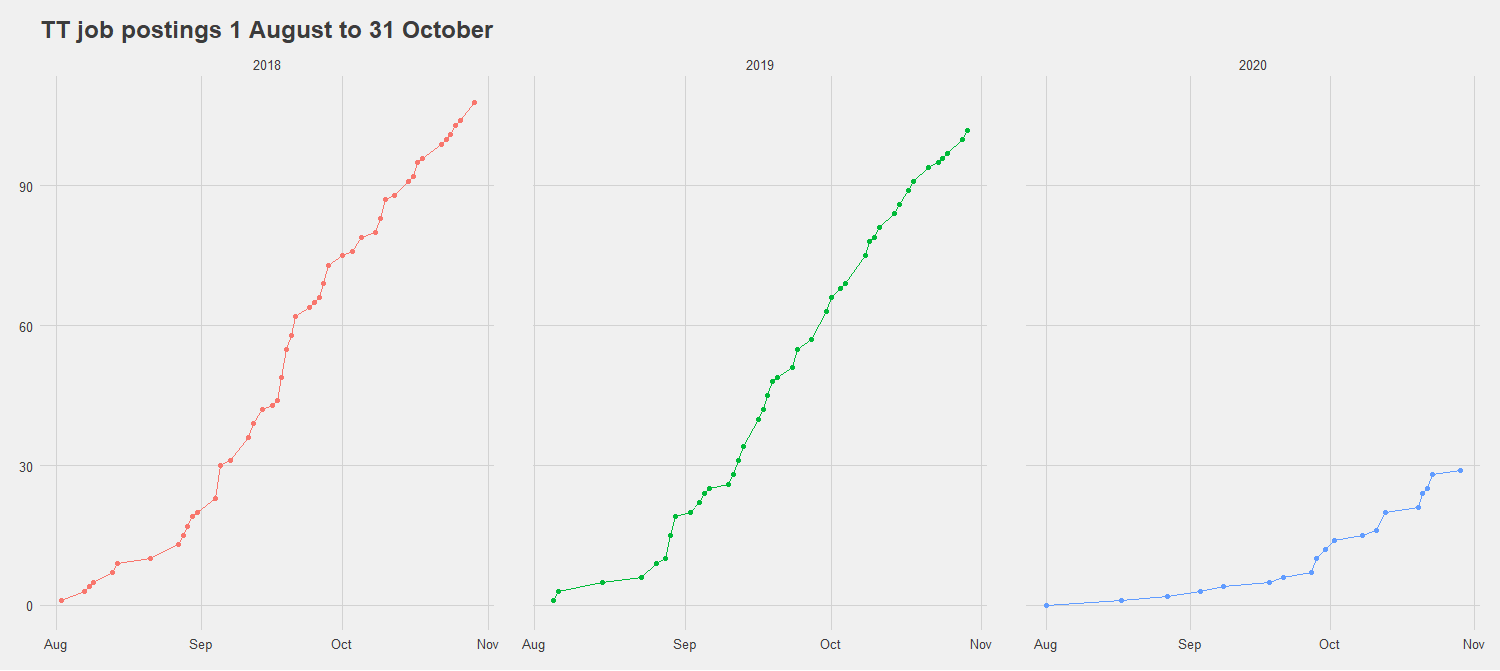
There have been 28 posted so far. In 2018 there were 108 posted by this time, and 102 posted in 2019. That's 73% fewer tenure-track jobs posted compared to this time last year. There will likely be some more jobs trickling in, but we've passed peak job-posting season. (Check out this blog post for details.)
Finally, let's look at the postdoc scene: 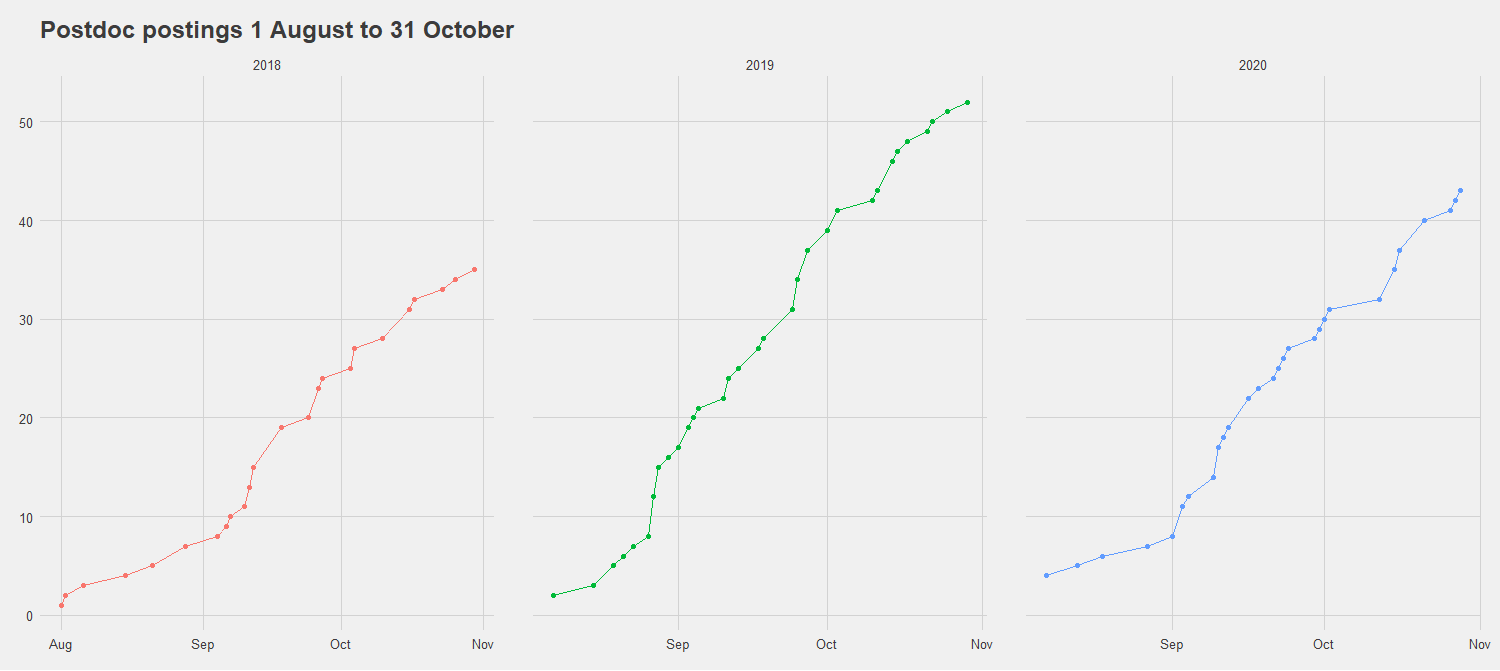
So here's one silver lining: the number of postdocs seems to be more or less in line with the last couple of years. I imagine that's because postdoc funding comes from different pots than faculty and admin funding.
The long-term effects of this are hard to discern, but of this much we can be confident: there's going to be a hell of a backlog of job-seekers for the foreseeable future. The job market wasn't pretty before, and it's only going to get worse. It's not as though the jobs are going to spring back right away, if at all -- but I'd love to be wrong about it.
In light of this, I hope that departments and the APA increase their efforts to promote non-academic careers. Yes, yes, I know there's an APA committee for non-academic careers, and I know every department can tout some of its graduates who have gone into non-academic careers. But the non-academic-career-side of professional philosophy is still the red-headed stepchild (no offense to my fellow gingers). The situation was already unsustainable, and the pandemic has only made matters worse. The profession can't keep continuing to prioritize academic over non-academic careers. This is an opportunity to grow and adapt. I hope the profession doesn't squander this opportunity. Princeton! They had nine job ads: eight postdocs and one assistant prof. Since the postdocs have names and institutes attached to them, I'm assuming the department doesn't do the selecting? How the heck does that work? (Clearly I wasn't fancy enough to win a named postdoc anywhere.) Who picks the Louis Skolnick Postdoctoral Research Associate? Surely it can't be the department doing the selecting. How the hell could any department do nine searches, even if eight are postdocs?
Runners-up include: 1. University of Chicago (three postdocs, two junior, one senior) 2. University of Pittsburgh (four open rank, one visiting fellowship, one junior) 3. Rice University (three open rank, two postdocs) 4. Stanford University (one open, one postdoc, one junior, one senior, one fixed-term junior) I'm at home moving my classes online and doing my best with my wife to (a) stave off illness and (b) home-school our kids. So I says to myself I says, "let's make Friday night crazy by doing some analysis of the 2018-2019 job cycle!" Strap in, nerds. It's gonna get nutty up in here. First, let's take a look at job postings for the last 5 years. Notice the obvious cycle: 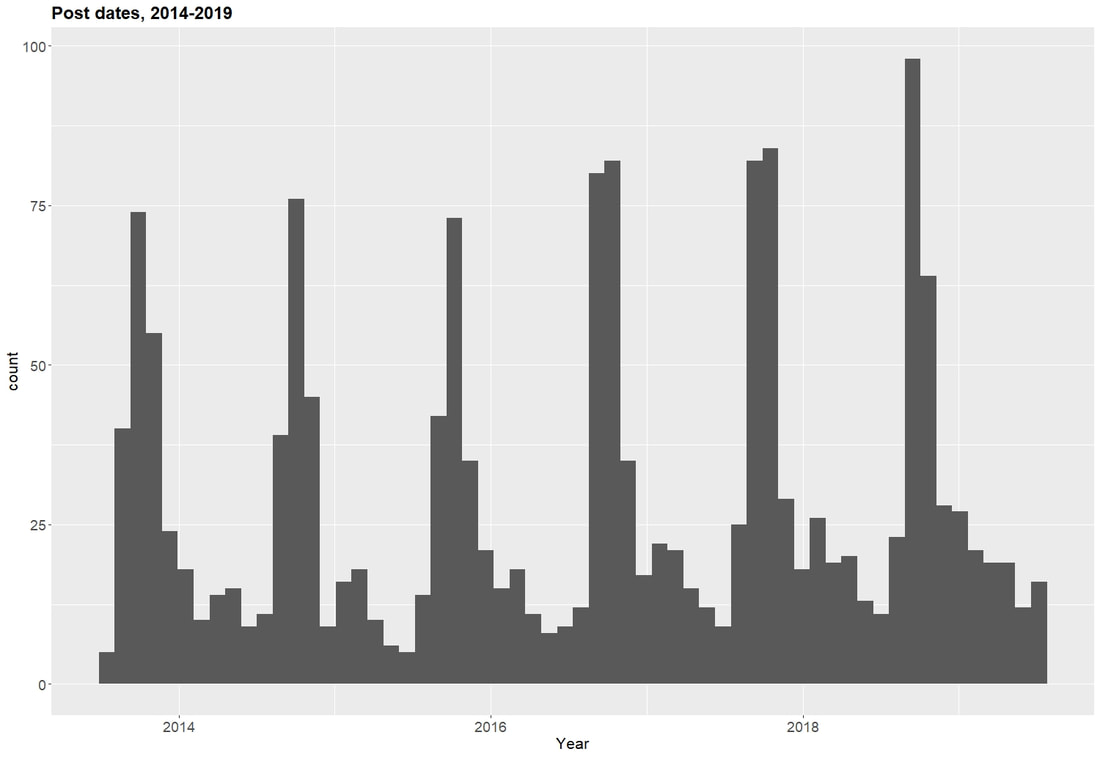 You can see each year's peak, which quickly tapers off. Now this is for posting dates. Let's check out for when apps are due. You'd expect the same kind of cycle aaaaaaand....... 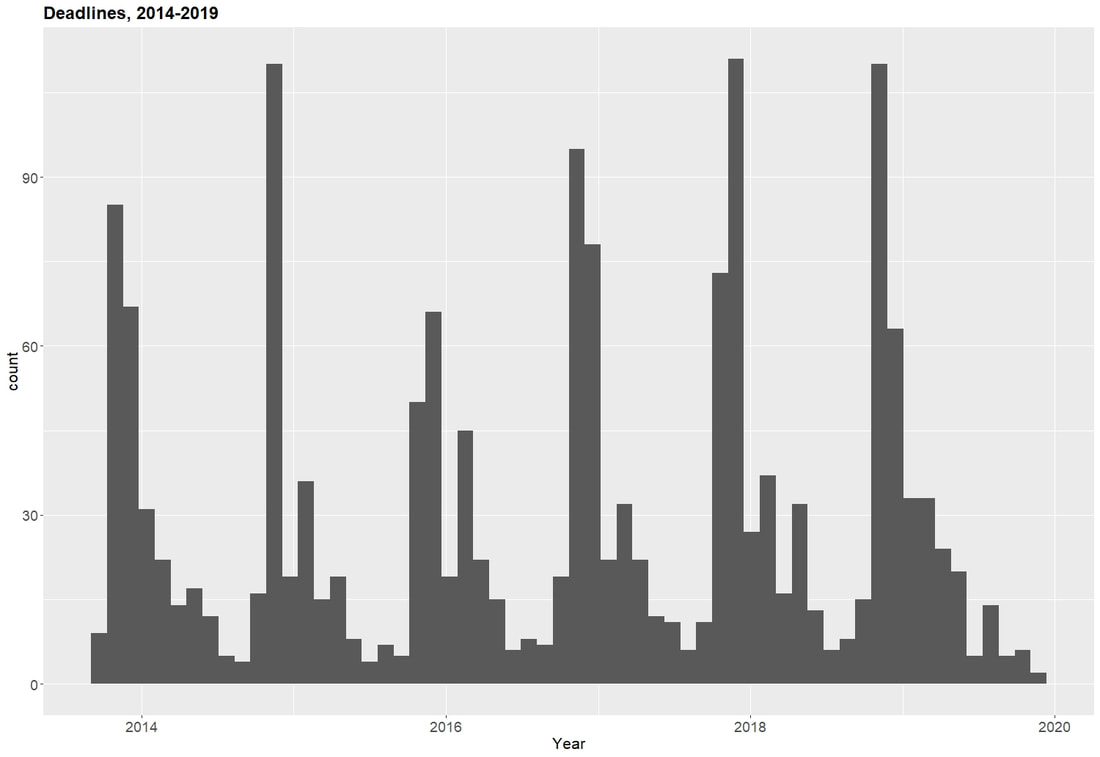 That's exactly what you get. Cool cool cool cool cool. Let's zoom in on posting dates for 2018-2019. FYI: 14 posts didn't fill in the "deadline" field. I guess is was in the body of the post? Annoying... 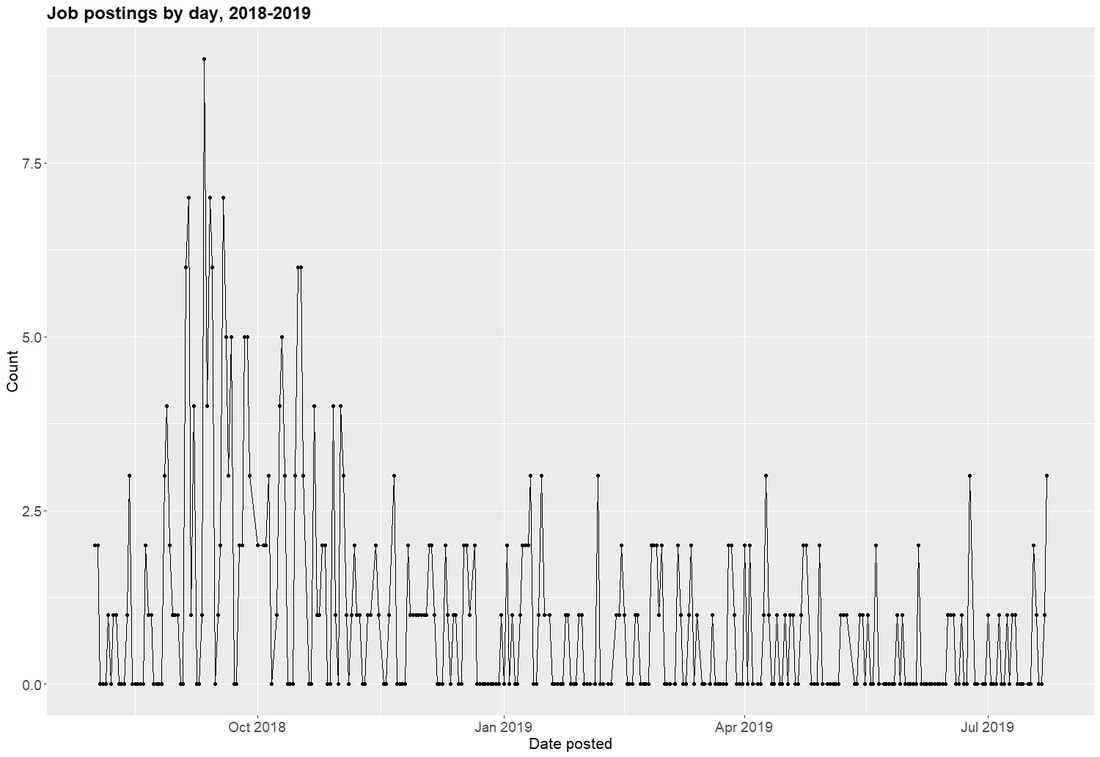 That peak you see is 9 job-postings in one day on September 11. But we can also see that the peak job posting period is August 28 - November 1. Those are the first and last days where there at least four job postings in a day. This period accounts for nearly half of all jobs posted during this cycle (153/322). Keep in mind we're filtering for junior, postdoc, and open rank positions. We can also see two longish stretches of days without posting jobs: from December 22 to January 1 and May 31 to June 15 (roughly -- there's a day with two posts in that stretch). Now let's take a look at when job apps are due. 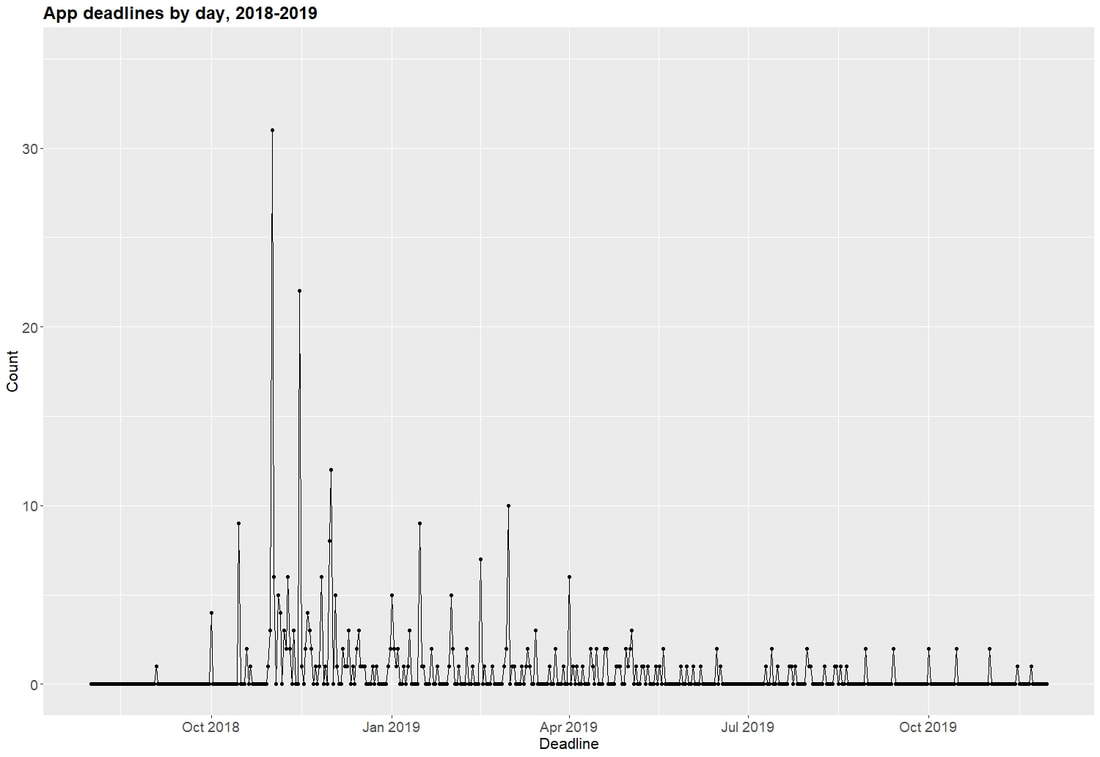 Holy guacamole! That peak you see is November 1. Here are the top 5 due dates with the number of deadlines on each day (well, top 6, since there's a tie for 5th place). November 1..... 31 November 15... 22 December 1...... 12 March 1............. 10 October 15........ 9 January 15........ 9 You get some downtime in the summer: mid-June to early July tends to be pretty chill. Are there differences by job type? 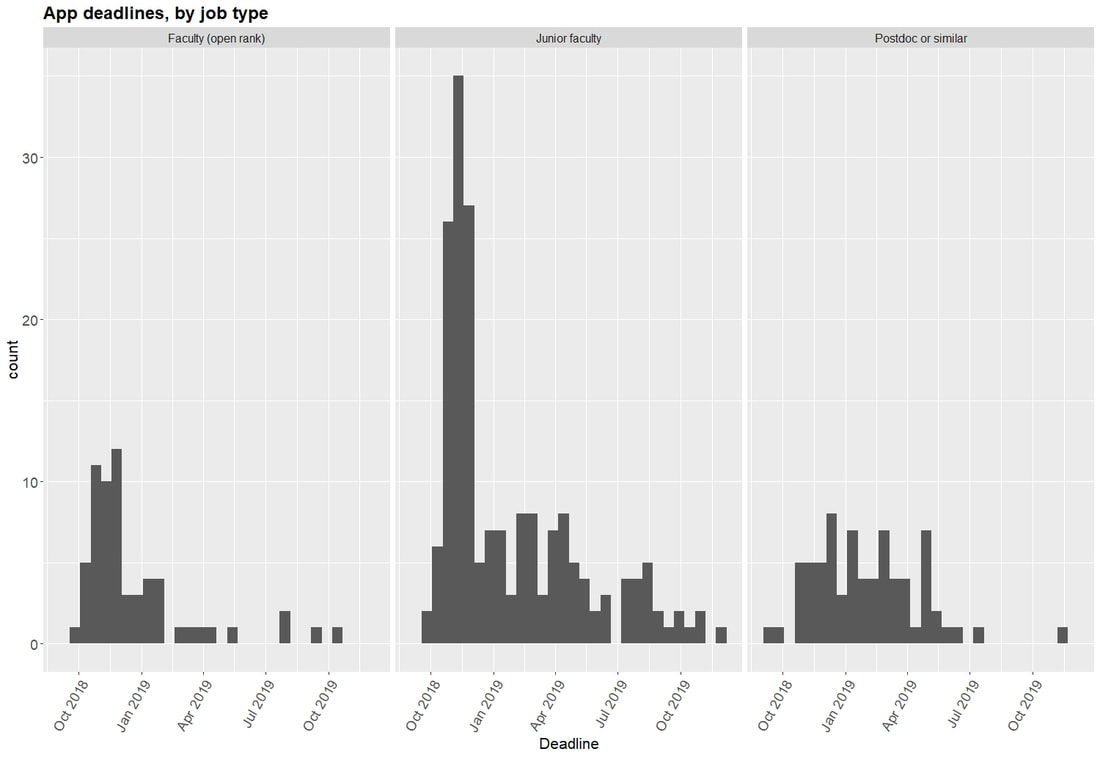 Open rank and junior faculty have their intense period in November. Postdoc apps don't have the same peak. The takeaway? If it's the fall and you absolutely have to choose between prepping junior apps and postdoc apps, focus on the junior apps. You'll miss some postdoc deadlines, but you'd do better to focus your energy on the junior apps. But wait, we can do even better. Let's look specifically at TT jobs and postdocs. 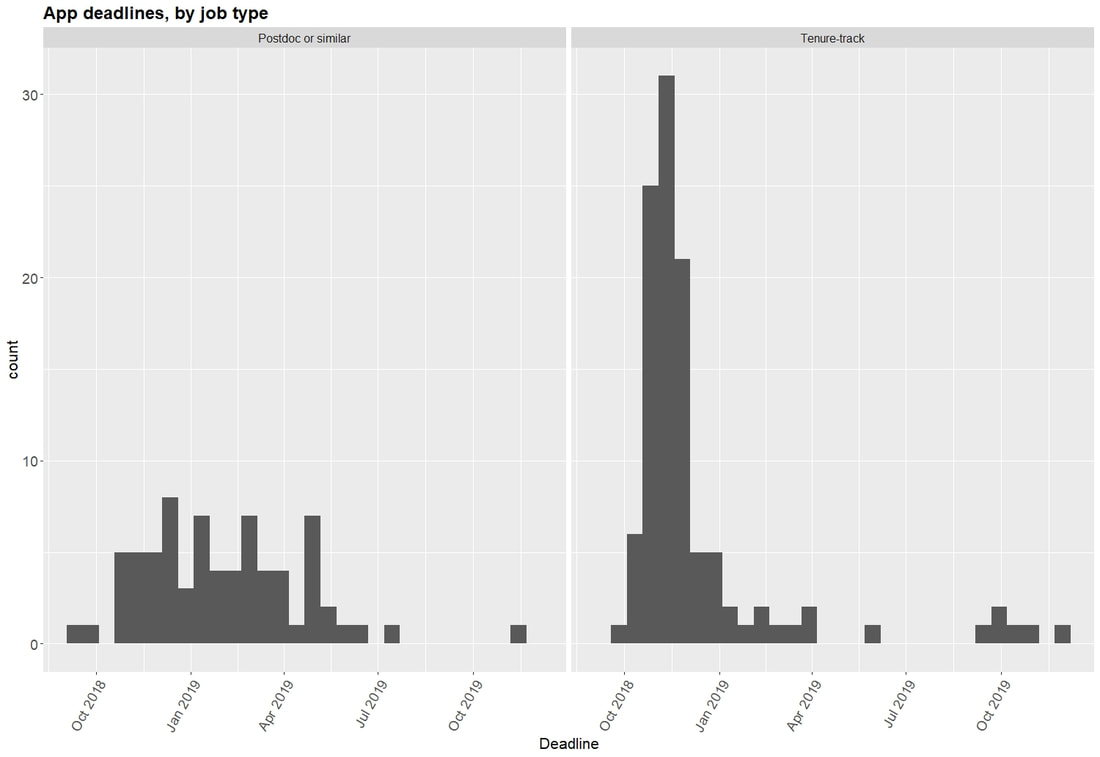 So it looks like the lesson holds even filtering out junior, fixed-term jobs. One more question: how much time to applicants get between the day the job is posted and the deadline? 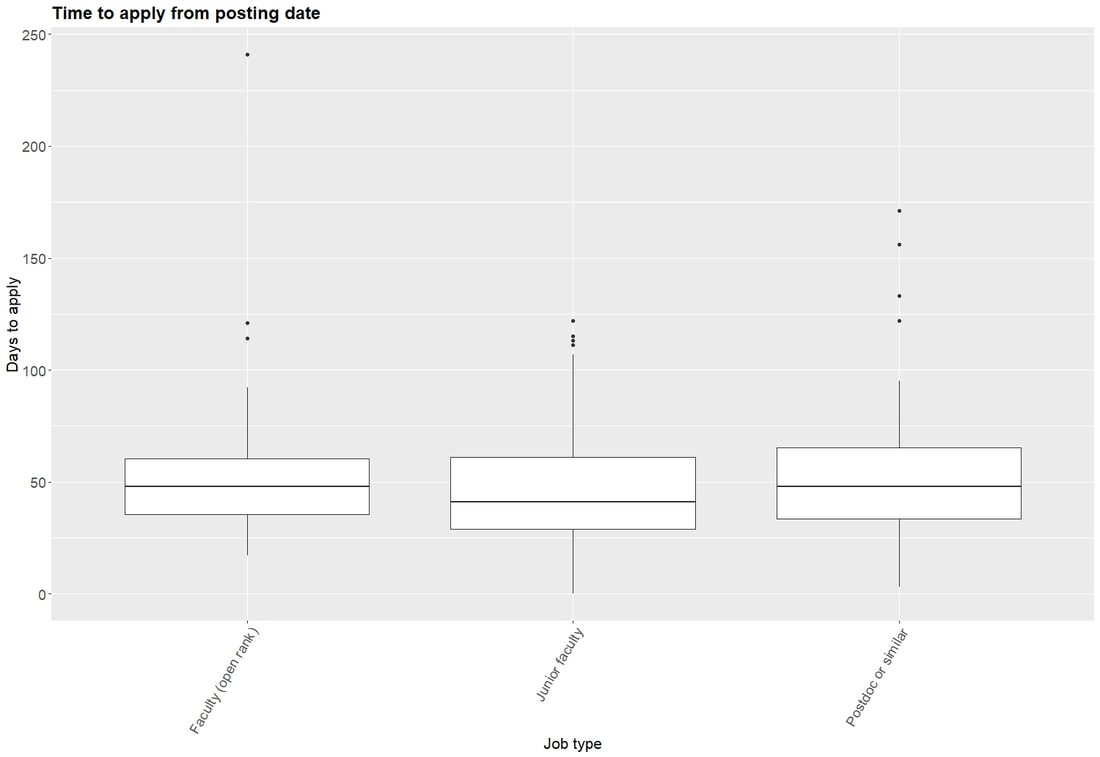 Your eyes do not deceive you. There's one junior job for which applicants had 0 days. Two plausible hypotheses: a typo or the posting the job was just a formality. Junior faculty openings have a median of 41 days and most apps are due between 30 and 60 days of posting.
For postdoc positions, the shortest time between the posting and the deadline is 3 days, but most are between 34 and 65, with a median of 48. But postdoc postings have more dispersed outliers. So there you have it. Some interesting findings about last year's job market. As always, feedback is welcome, especially if there's other analyses you'd like done. I recently downloaded some data from PhilJobs on job openings in the past few years. I wanted to share some findings from that dataset: some where's and when's. The data has a number of variables of interest: hiring school, kind of job (academic or not), date the ad was posted, date apps are due, level of job (postdoc, junior, etc) and contract type (TT, fixed-term, etc), among others. With these data, we can ask some interesting questions. Here's what we're looking at today. 1. how many jobs were there? 2. where were the jobs? like literally, where in the world were the jobs? I filtered the data for three kinds of job: junior faculty, postdoc and open rank hires. (FWIW filtering for "junior" doesn't discriminate between TT and fixed-term. We'll have a chance to separate out TT and fixed-term later.) We might look at admin jobs or senior hires, but I'm not terribly concerned about those groups, tbh. When reflecting on how terrible the job market is for philosophers, the usual victim is a newly-minted (or newishly-minted) PhD looking for steady employment. And as far as the boundaries of the hiring cycle, I used August 1 to July 31 to define 'hiring cycle'. As we'll see, jobs are posted year-round, but these bounds feel natural for identifying the beginning and the end of a cycle. But before we completely leave the non-junior jobs behind, let's look quickly at the number of jobs posted last year in each category. 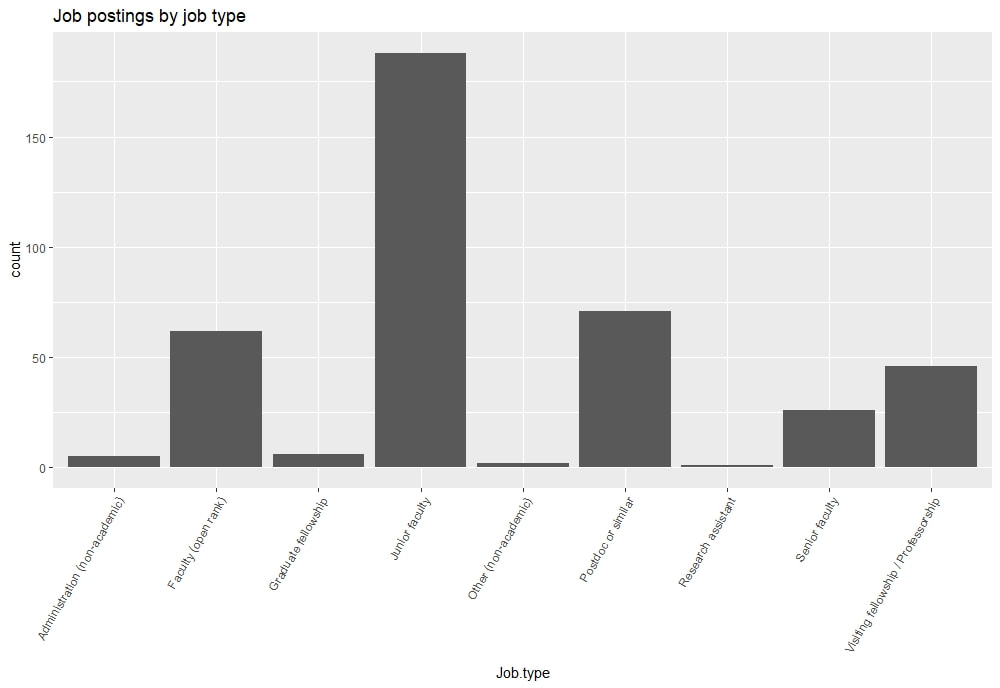 So during the 2018-2019 hiring cycle, there were roughly 180 junior jobs, 70-ish postdocs, and 60-ish open-rank. Let's zoom in on the junior faculty 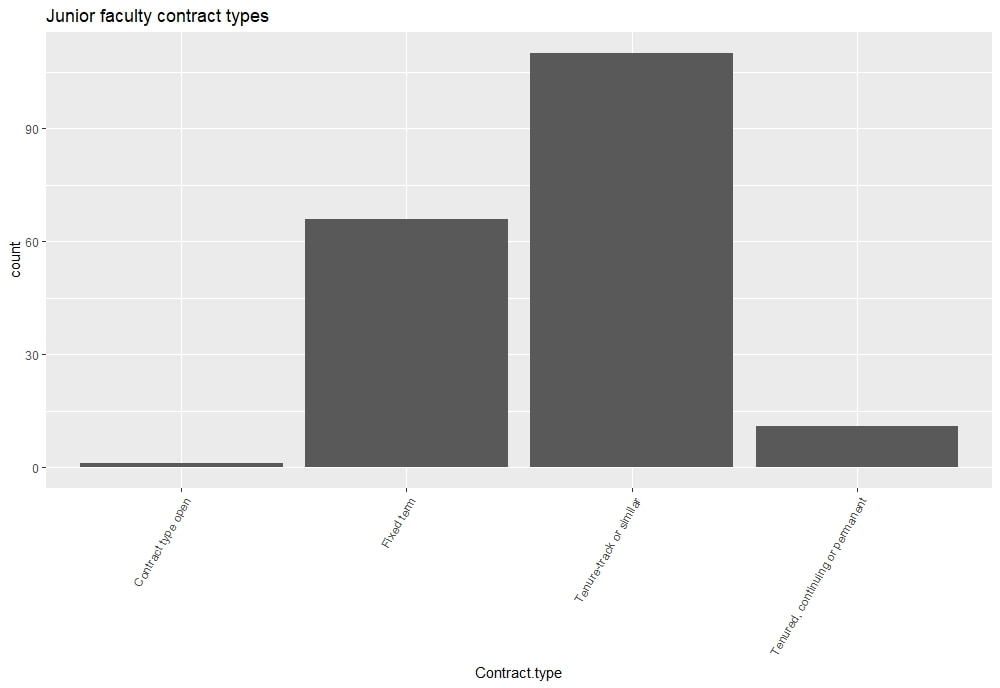 So 110 or so jobs are TT and 65 or so are fixed-term. 10-ish are junior but "tenured, continuing, or permanent." I imagine this is a catch-all category for "junior faculty, long-term" Now, let's look at where the jobs are. I used the ggmap package. Word to the wise: this package is awesome, but make sure you (i) get your google apps key and (ii) enable the static maps API. (Details are in the documentation for ggmap.) It took me forever to figure out that I didn't tell Google that I wanted to use the static maps. Anywho, we'll start with postdocs, junior faculty, and open rank and then focus on junior positions. 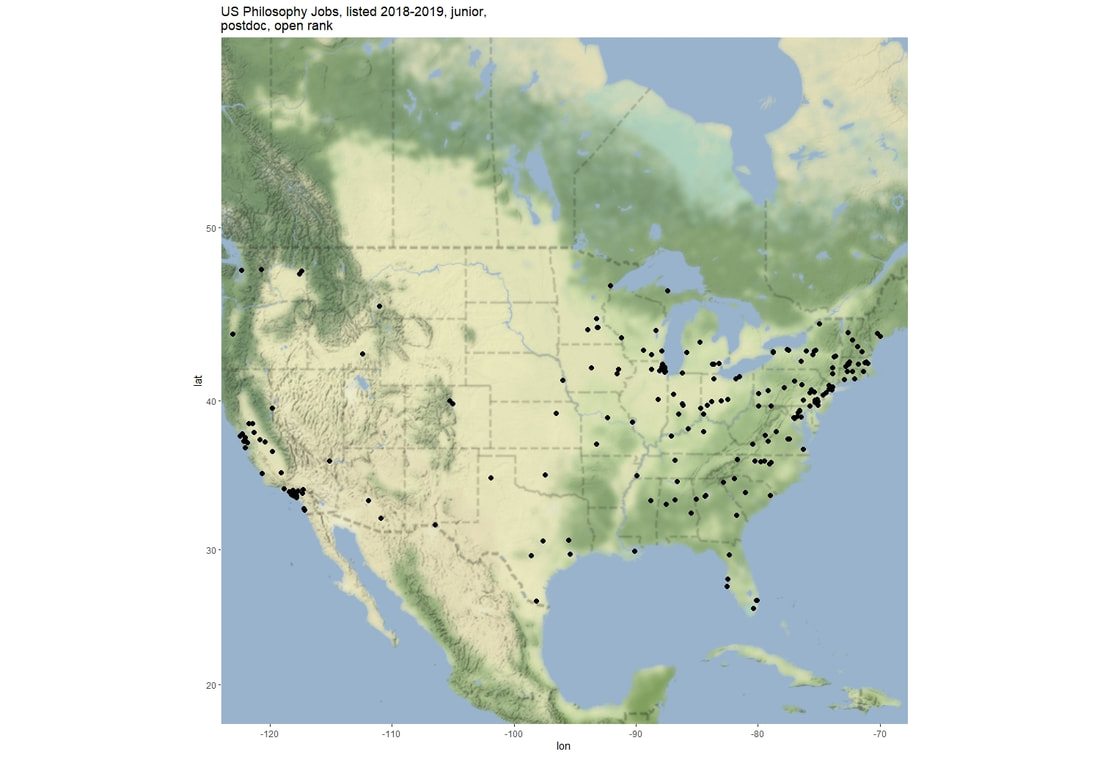 So here's something interesting: most jobs are on the east coast -- particularly the northeast corridor -- or California. No jobs in the Dakotas, Utah, Wyoming, or New Mexico. Now let's look at junior faculty jobs, and we'll color the dots by contract type. 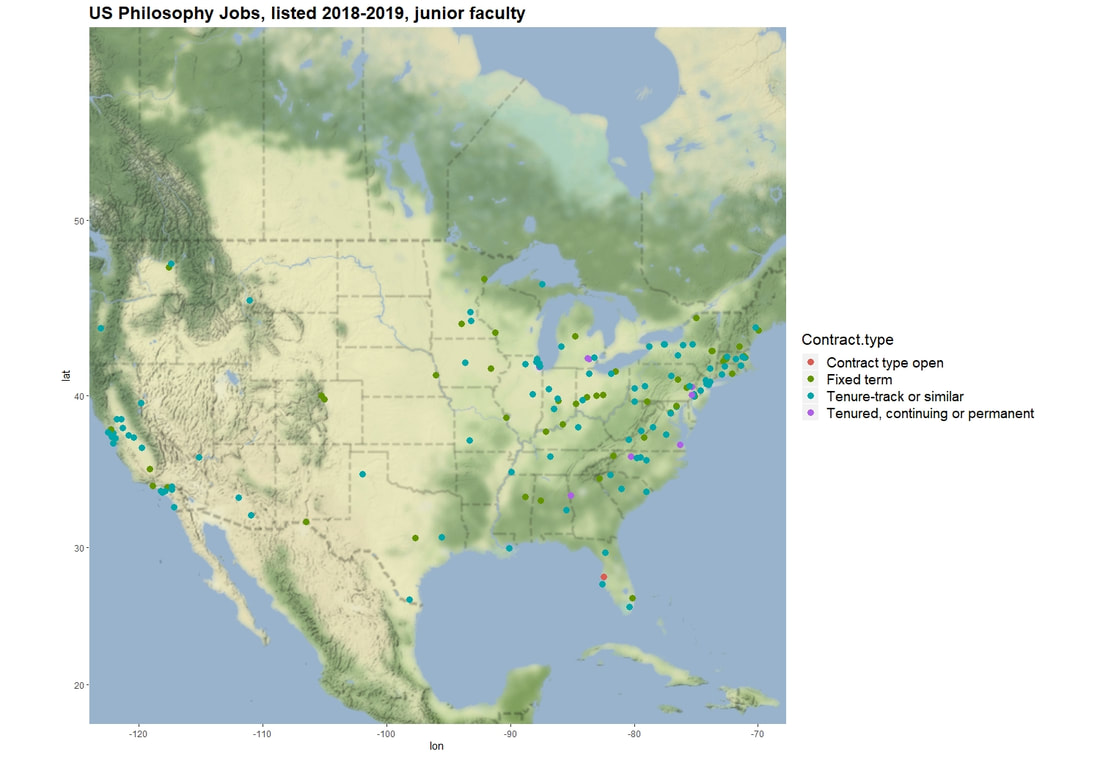 There's no clear pattern to TT vs fixed-term jobs in terms of location. CA had a bunch of TT jobs. So did the northeast. What's the takeaway? There's a big divide in the density of job openings east and west of the Mississippi River. Once you move west of those states whose eastern borders are the Mississippi, jobs are a lot scarcer. Beyond that, there are higher concentrations of jobs in (1) California and (2) the northeast (NJ, NY, CT, MA...and also some bordering states like PA, VA, and MD). If you get your PhD on the east coast or CA, you have a decent chance of staying there. So I says to myself I says, "I wonder how this compares with median household income per county..." Here's the map: 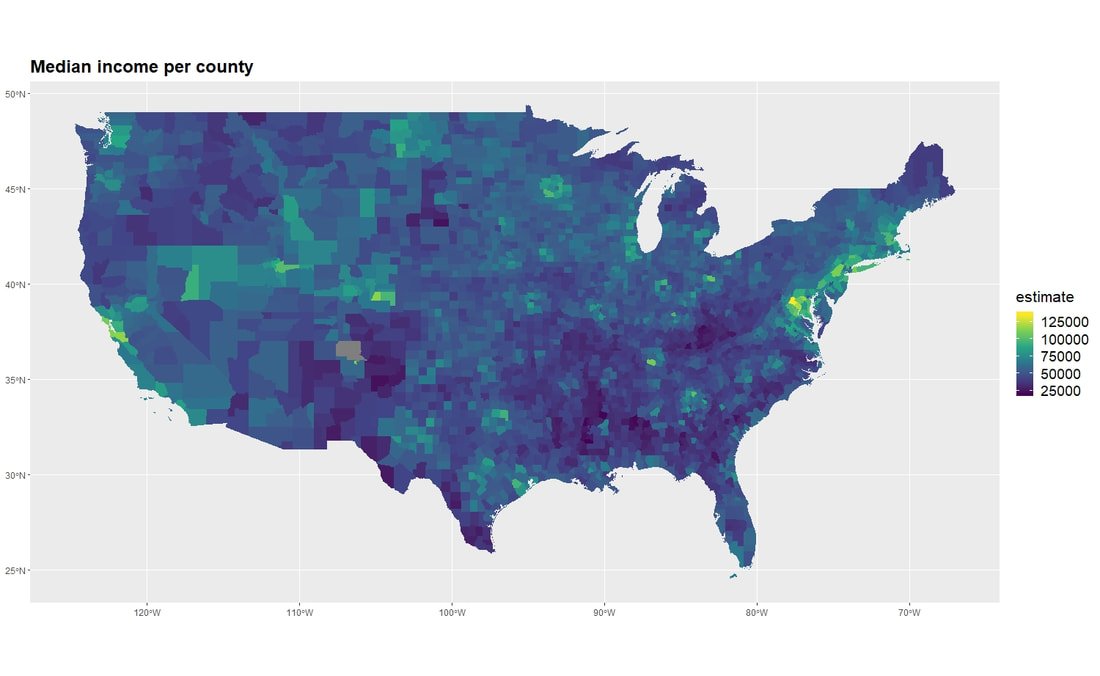 Hmmm.... nothing obvious. The northeast and Midatlantic regions have a higher median income per family than lots of other places in the country. (Holy shit -- Northern Virginia has a median income of $125k! That's higher than the Bay Area! And I'm astonished because I grew up the son of a handyman in NoVa.) More detailed investigations might yield something, but now it doesn't look like much.
"So Charlie, why are you doing this given your stack of grading and journal deadlines?" you might be wondering. Well get off my back! You're not my real mom! I have an abiding interest in the culture of professional philosophy. A lot of that culture is moving online, which is handy for folks like me who know enough about coding to get themselves into trouble and just enough to get themselves out of it (most of the time). LR boasts on his blog that it's the "world's most popular philosophy blog since 2003". (Maybe that's true? IDK if he's got the stats for Daily Nous. But of course "since 2003" might describe the blog's birth year and not how long it's been most popular.) It's influential in our profession; I have no doubt that many people read it. I also know that at least some people have VERY STRONG OPINIONS about LR and BL himself. Given how popular it is, it's worth getting the big picture of the blog. If we wanted to describe the last year of blogging in a nutshell, we might say that LR is a lot like Slate or National Review: lots of good and important news interspersed with a lot of editorializing. How do we come to this conclusion? There is a lot of news about the profession and academia in general shared; there is also quite a bit of news about stifling academic freedom and rights to free speech; and more info on the PGR and job search advice. But along with all that are opinions expressed about Weinberg, Manne, Jenkins, Ichikawa, and the Twitter Red Guard. (I will note that there are no tags for Christa Peterson or Nathan Oseroff-Spicer, both of whom get mentions in the content of posts. BL tags tenured faculty at institutions with PhD programs, but not grad students. I, for one, can appreciate that. Maybe I'm reading too much into it, but it seems a bit more punching sideways than down, at least with respect to tags on LR.) Leiter's Year in Review doesn't reflect his overall blogging patterns for the year (not that it has to). If I had to speculate, the posts picked are the most sensational ones and not the ones that reflect the blogging practices. You might get a more representative view of the blog by following the "Phil in the News" tag and then skimming some entries at random. Finally, maybe you're interesting in our three areas of investigation for the whole year? Here ya go. 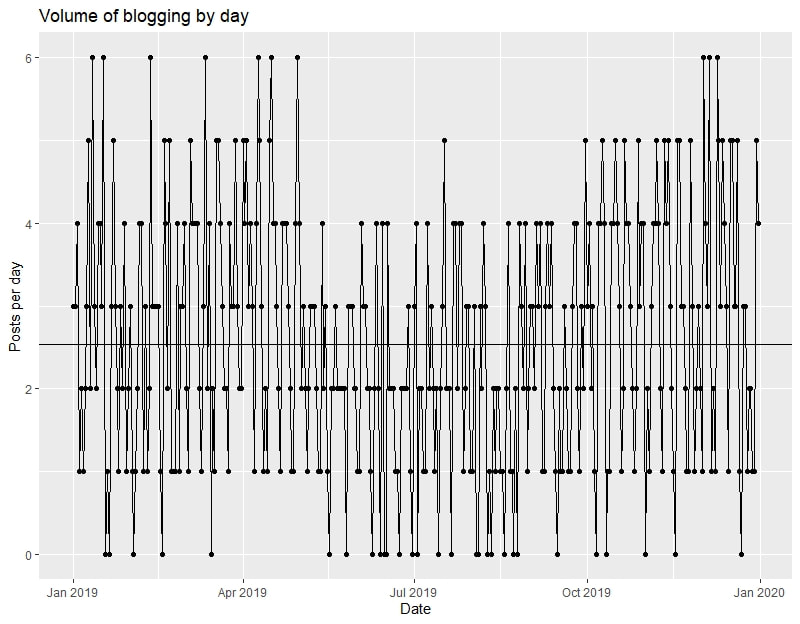 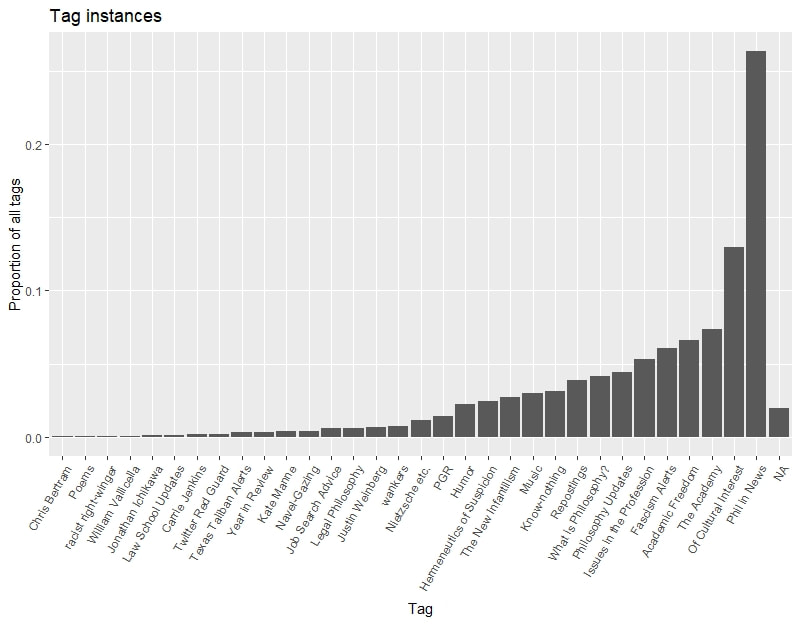 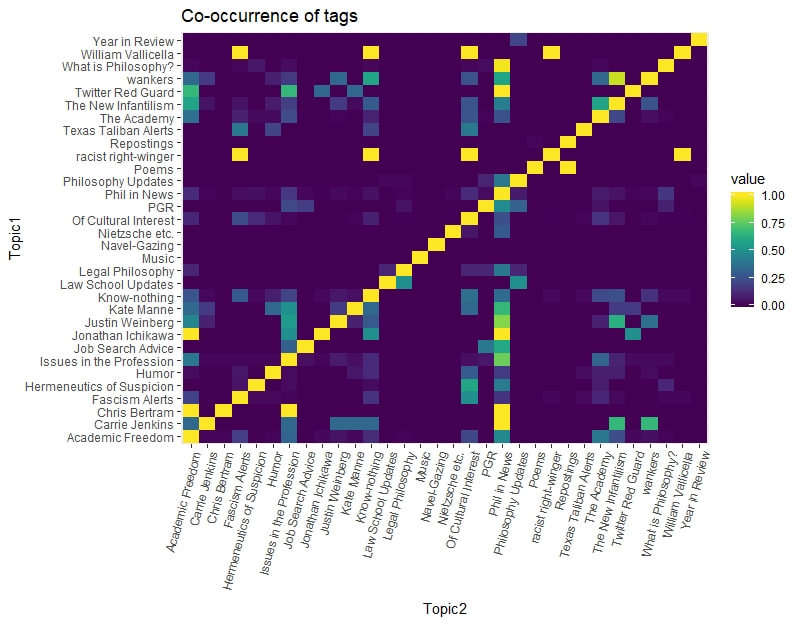 Go here for methods. 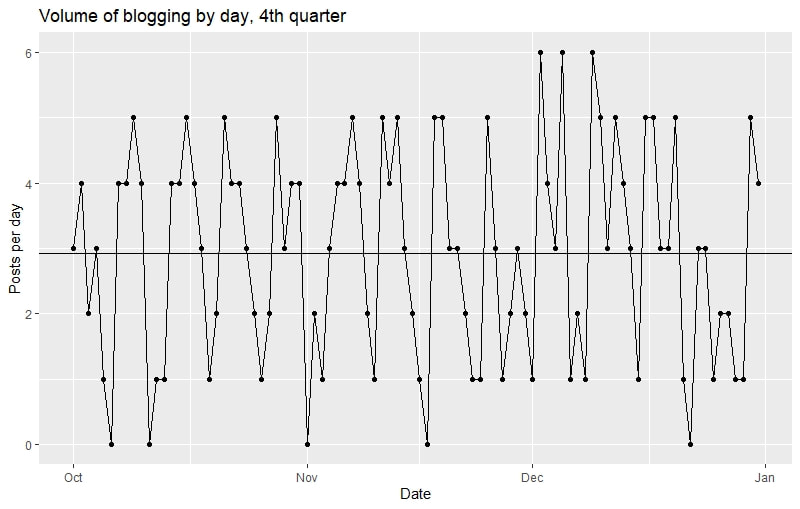 Lot's of blogging happening here -- only 5 days off! On average 2.9 posts per day. Looking at the shape of the plot, it seems a bit like a very sharp and compressed sine wave: days with one or fewer posts are usually followed by an upswing in posting, followed by a sharp decline. Not perfectly, of course, but close enough to suggest that high-posting days are followed by days of little posting until bottoming out in 0 or 1 posts on a day, with the cycle beginning again. 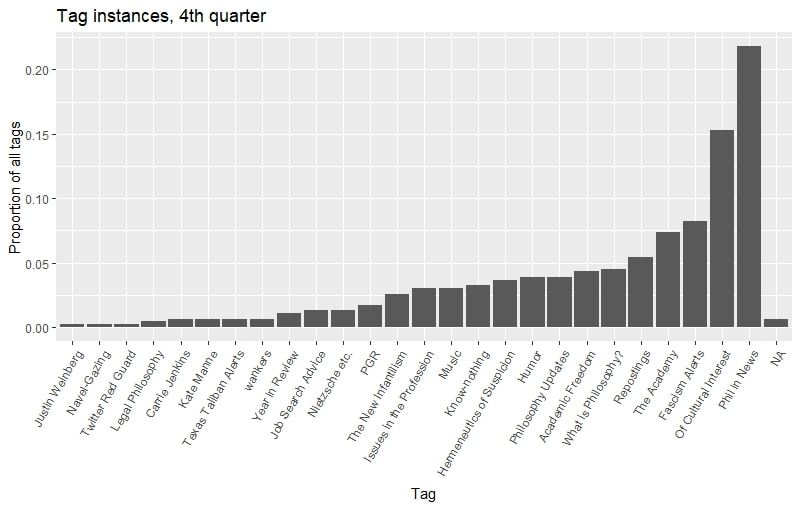 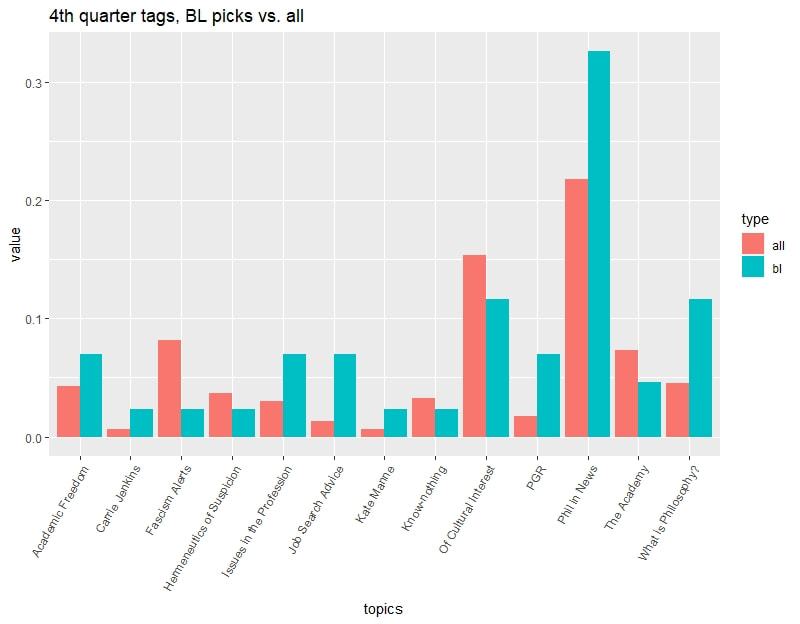 This broadly follows the pattern from previous quarters. "Fascism Alerts" is underrepresented in BL's picks (unusually). Named-philosophers are are slightly over-represented in BL's picks. And the PGR is definitely over-represented in BL's picks.
|
About me
I do mind and epistemology and have an irrational interest in data analysis and agent-based modeling. Old
|
 RSS Feed
