Soaked Feet,
Bone-dry cuffs

|
Brian Leiter ("BL") posted his 2019 "Year in Review" on Leiter Reports ("LR"). I looked for criteria about how he picks them and didn't see anything. My guess is that he picks posts that he found compelling throughout the year. So I says to myself I says, "I wonder how that compares with his blogging for the entire year." I'd been working on a project scraping all 300 or so pages of LR and thought I'd start out smaller: scraping his posts for 2019. (The entire LR scraping project will come along sooner or later. I'm off sabbatical now and have substantially less time.) I used the rvest package created by the great Hadley Wickham. If you're already good with the tidyverse, then web-scraping with rvest is a pretty easy learning curve. Just make sure you read the tutorial on using the SelectorGadget! And thank goodness WordPress is so easy to scrape: pages are individuated by the base URL (http:\\... etc.) and then a sequence of numbers. The method here is pretty simple. I scraped LR for tags and dates. There are three questions I'm interested in answering: 1. what are blogging patterns like? i.e. how frequently does BL post on LR and how much each day? 2. what tags get used most frequently? 3. what's the frequency for co-occurring tags? In this post and the next three, I'll answer these three questions. Then I'll attempt a wrap-up. 1. Frequency To me, this is probably the least interesting question, but it's one that can be answered easily. UPDATE: This was not as easy as I suspected (but it was still a useful exercise). Scraping LR gave me the dates that BL posted but it doesn't fill in the dates he doesn't post. Here's a good set of instructions for how to fill those in. Here's a line graph showing the volume of blogging from 1 January 2019 to 31 March 2019. 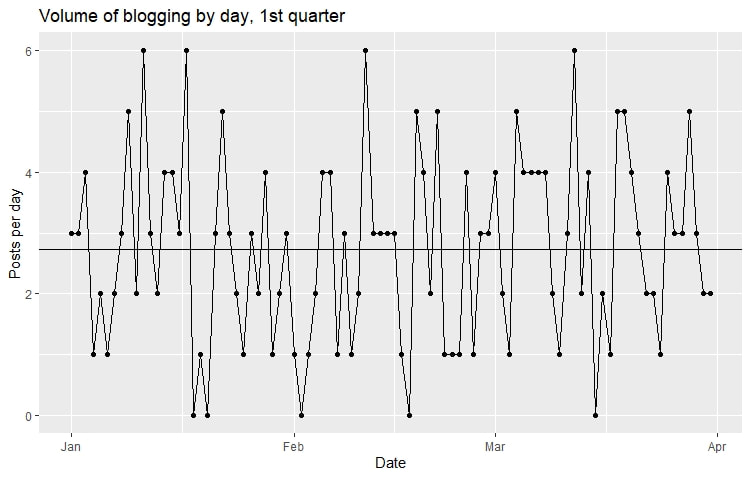 BL is a prolific blogger. He took off from blogging only five days in the 1st quarter! At most, he's posted 6 times in a day and on average he posted 2.7 times a day. 2. Tags A quick methodological note: I often shortened the tag to something that captured the spirit of the tag but was much more readable on a plot. E.g. "The less they know, the less they know it" was shortened to "know-nothings." Also, all guest bloggers were collapsed into "guest" (but BL hasn't had many guest bloggers on in the last few years, so that's not a worry for right now). What tags got used the most during the 1st quarter? Here's the histogram. 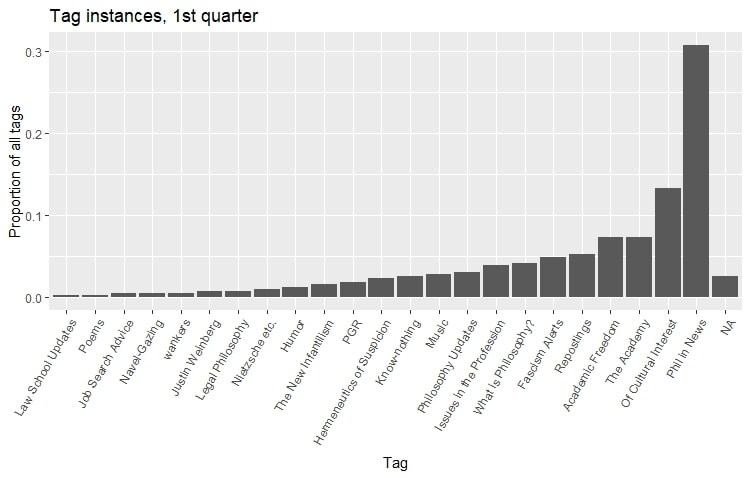 'NA' indicates those days when BL didn't use a tag. So what's to see? BL's go-to tags are about philosophy in the news and stuff of cultural interest. He doesn't use LR for law school updates very much. In fact, the majority of the tagging is about issues related to the profession. BL posts quite a bit more about professional issues that what he colorfully calls the "Twitter Red Guard" and "The New Infantilism." Nonetheless, he has a special place on his blog (and in his heart?) for Justin Weinberg and a handful of other folks (as we'll see in the next few posts). However! The "Phil in the News" and "The Academy" tags are often paired with "Justin Weinberg" and "The New Infantilism." So at least some of the professional-issue tags are also about the subculture in our discipline that prefers Daily Nous to LR. What can help clear this up is a plot looking at tag co-occurrence. 3. Tag co-occurrence This plot shows how often pairs of tags so up together. (This is a super helpful set of directions for computing the co-occurrence matrix.) 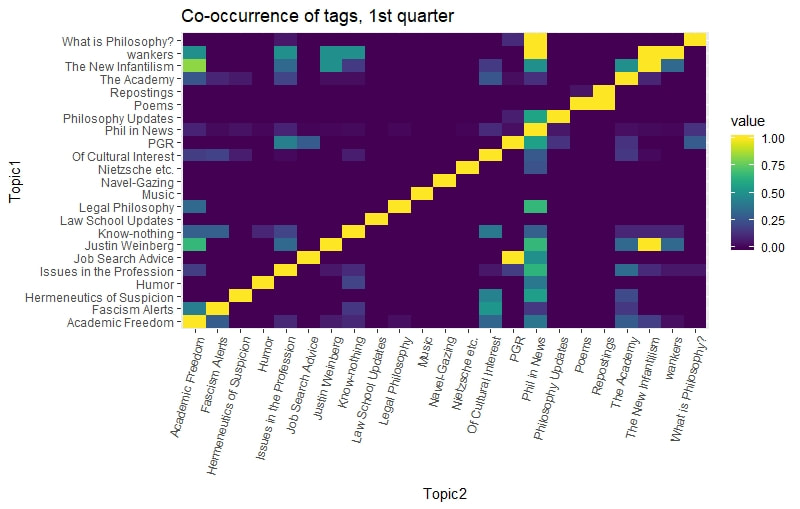 So what does this tell us? Notice first that the plot isn't symmetrical: what's above the yellow diagonal isn't the mirror of what's below. So for any co-occurrence of two topics, you could have two different values. Look at "Academic Freedom" and "Justin Weinberg" for an example. To interpret the plot: wherever the co-occurrence, it's relative to the total number of occurrences of Topic 1 along that row. Take "Academic Freedom" and "Justin Weinberg" to start. The plot tells us the co-occurrence of these tags relative to all occurrences of each. To find their frequency relative to "Academic Freedom", find the intersection of both but with "Academic Freedom" appearing as the row value. Their co-occurrence relative to all instances of "Academic Freedom" is rather low (~.07). But the co-occurrence of "Academic Freedom" and "Justin Weinberg" relative to all instances of "Justin Weinberg" is rather large (it's about .67). So Justin is one concern about academic freedom on BL's blog, but he's far from being the only one. But whenever BL is talking about Justin, it's often about academic freedom. Why do it this way? It doesn't make sense to relativize everything to the topic with the greatest number of tags. It just swamps everything. "Fascism Alerts" and "Cultural Interest" co-occurred 10 times, but that's a blip against the total number of times "Phil in the News" showed up (which is 454). I tried relativizing to whichever of the Topic 1 and Topic 2 was larger. This makes a symmetrical plot but it papers over important info. If A and B have a co-occurrence value of .5, it's not clear whether that's relative to all instances of A or B. So what does the plot tell us? One thing that stands out is the rather light-colored column for "Phil in the News". This tells us that "Phil in the News" is a rather promiscuous tag, relative to how often other tags are used. This is confirmed by the relative dark shading of "Phil in the News" for Topic 1: no single tag stands out relative to the total number of tokens of "Phil in the News." A few other bright-colored spots:
Let's compare these last two plots to the posts BL picked out in his year in review. The method here is exactly the same as before. The only difference is in the scraping code: I went to the collection of links for the 1st quarter of the year in review, grabbed those links, and then scraped the tags. 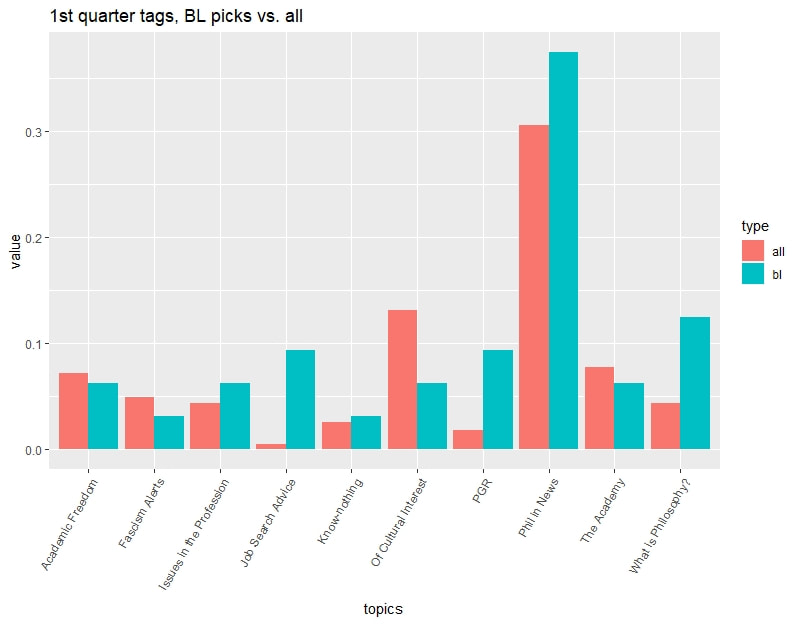 Some stuff to see here: "Phil in the News" is top again, but that's not surprising given how promiscuous the tag is. "PGR" and "Job search advice" occur a lot more often in BL's picks than in the 1st quarter overall. Let's look at the co-occurrence plot. 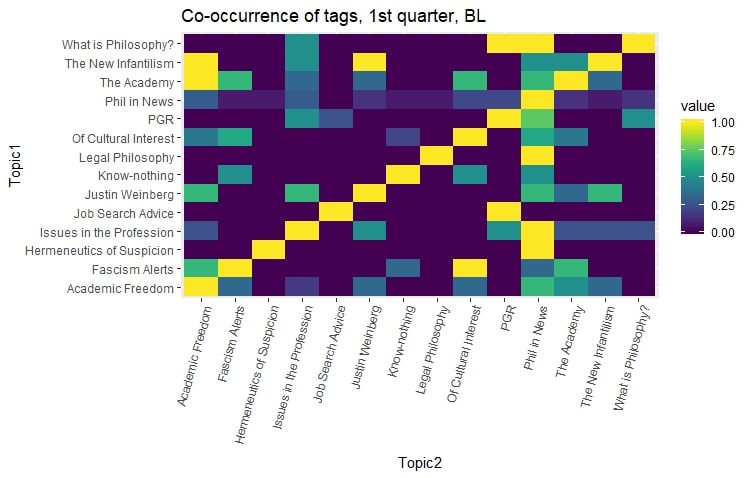 And there's the previous one for easy reference: Co-occurrence of "New Infantilism" and "Academic Freedom" relative to all instances of the former is greater in BL's picks than in the 1st quarter overall; samesies replacing "New Infantilism" with "The Academy". And "What is Philosophy" co-occurring with "PGR" relative to all instances of "What is Philosophy" is also overrepresented in BL's picks.
0 Comments
Leave a Reply. |
About me
I do mind and epistemology and have an irrational interest in data analysis and agent-based modeling. Old
|
 RSS Feed
