|
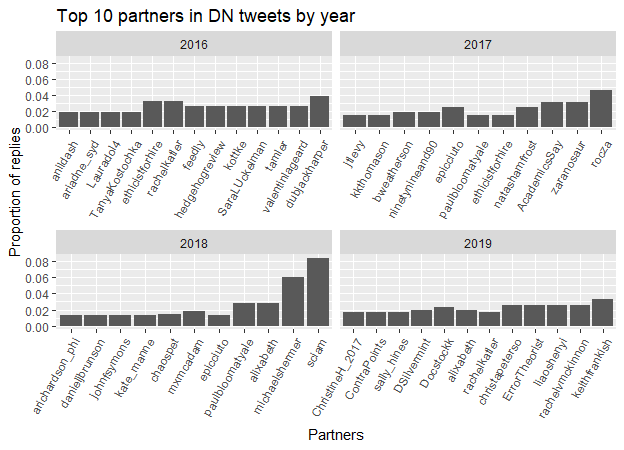
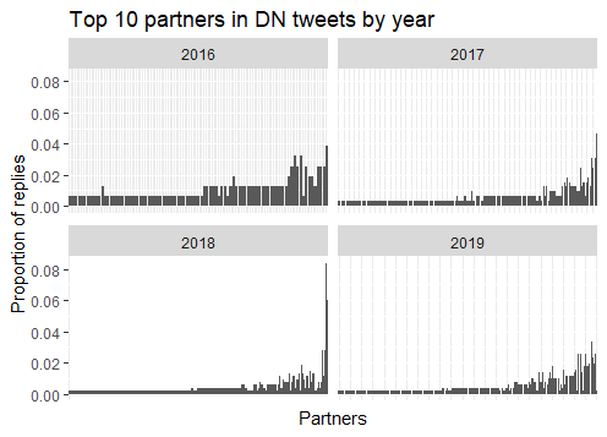
Another quick post. Here's a plot of the top 10 partnerings by year. (Recall that R returns all values in cases of ties... hence why there are 13 accounts listed in the 2016 graph. Oh and if anyone knows how to order the x-axis in ggplot2 while employing facets, I would be eternally grateful for pointers. I tried everything I could think of and Google and nothing worked.) Some interesting things to see here. First, DN is partners in 2019 more frequently with philosophers of sex and gender (@Docstockk, @christapeterso, @rachelvmckinnon) -- or at least folks vocal in the debate online -- than in previous years. Second, among the top 10, with the exception of @sciam and @michaelshermer in 2018, there's no clear preference for one over another. I.e. within the top 10 accounts with whom DN partners, there's no one that is head and shoulders parterned with more than another. Third, no account is in the top 10 from year to year. The DN account doesn't consistently partner with one account over multiple years. One last plot: let's look at all partnerings for DN over the same stretch of time. Names of accounts are not included because they're unreadable. But it's still pretty neat to see the shape of each plot: Broken out by year, there's not the kind of long tail that we saw in the 1st post (except in 2018). But what is clear is that the DN account, over the last 4 years, engages with more accounts (2016 had 89 partners, 2017 had 162, 2018 had 221, and 2019 has 189 -- though keep in mind that the 2016 counts only go back to March because of query limits on Twitter's API). But there's still a subset of accounts each year that get partnered with more frequently than others, even though the most-partnered accounts change from year to year.
So there you are. We've looked at the folks the DN account responds to or mentions most over the last 4-ish years.
0 Comments
Leave a Reply. |
About me
I do mind and epistemology and have an irrational interest in data analysis and agent-based modeling. Old
|


 RSS Feed
